

Bad news for South Africa as GDP declines, with previous growth revised lower



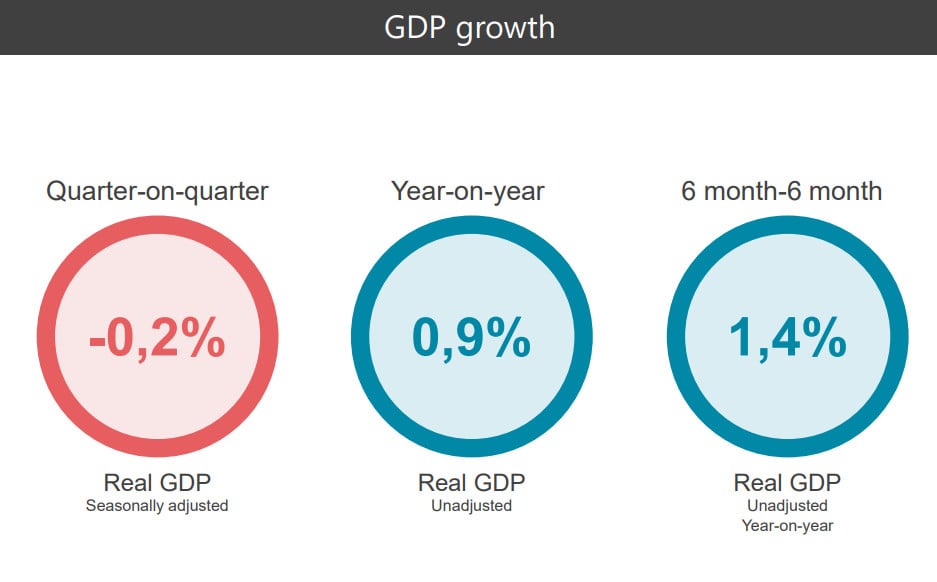
South Africa recorded a decline in gross domestic product in the second quarter of 2026, in line with economists’ and analysts’ expectations.
According to the latest figures from Stats SA, GDP declined 0.2% in Q2 of the year, after recording 0.4% GDP growth in the first quarter, revised downward from the 0.5% previously reported.
The result was unsurprising, given the impact of the United States’ war with Iran, which had erupted at the end of February, filtering through the global economy in the months that followed.
South Africa was not left unscathed, which is especially tragic, as the war has disrupted the country’s winning streak.
The country had recorded six consecutive quarters of economic growth since Q4 2024, posting annual growth of 1.1% in 2025.
Despite the drop in Q2 2026, economists still expect a full-year GDP reading of 1.2%, up 0.1 pp from 2025, with GDP averaging 1.7% over the next three years.
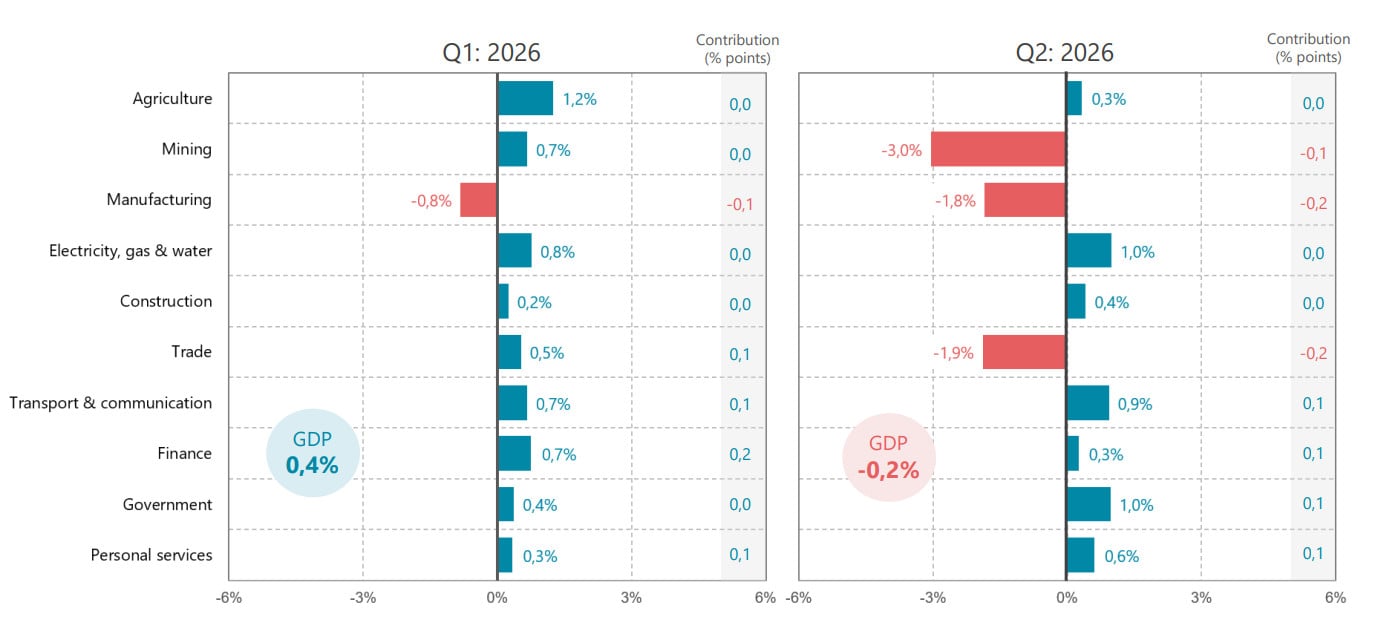
Looking at sectors, Stats SA pointed to sharp negative contributions from key industries like mining, manufacturing and trade.
The trade, catering and accommodation industry decreased by 1.9%, contributing -0.2 of a percentage point.
Decreased economic activity was reported in wholesale trade, motor trade, and food and beverages.
The manufacturing industry decreased by 1.8%, contributing -0.2 of a percentage point. Seven of the ten manufacturing divisions reported negative growth rates.
The mining and quarrying industry decreased by 3.0%, contributing -0.1 of a percentage point. The largest negative contributors were platinum group metals (PGMs), manganese ore, gold and iron ore.
Other industries eked out growth, despite the global market turmoil.
The finance, real estate and business services industry increased by 0.3%, contributing 0.1 of a percentage point.
The main contributors were financial intermediation, insurance and pension funding, and other business services.
The transport, storage and communication industry increased by 0.9%, contributing 0.1 of a percentage point. Increased economic activity was reported for land transport.
General government services increased by 1.0%, contributing 0.1 of a percentage point.
This was mainly due to an increase in compensation of employees in extra-budgetary and higher education institutions, and the provincial government.
The personal services industry increased by 0.6%, contributing 0.1 of a percentage point. Increased economic activity was reported among community services and other producers.
Expenditure on GDP
Expenditure on real GDP decreased by 0.2% in the second quarter of 2026, following an increase of 0.4% in the first quarter of 2026.
Household final consumption expenditure (HFCE) increased by 0.4%, contributing 0.3 of a percentage point to the total negative growth.
Positive growth rates were reported for services, durable goods and non-durable goods.
The main positive contributors to the increase in HFCE were expenditures on:
- Food and non-alcoholic beverages (1.2% and contributing 0.2 of a percentage point)
- ‘Other’ (0.6% and contributing 0.1 of a percentage point)
- Recreation and culture (0.8% and contributing 0.1 of a percentage point) and
- Health (0.7% and contributing 0.1 of a percentage point)
The negative contributors were expenditures on housing, water, electricity, gas and other fuels; transport; communication; and clothing and footwear.
Final consumption expenditure by general government increased by 0.4%, contributing 0.1 of a percentage point to the total negative growth.
This was mainly driven by an increase in the compensation of employees.
Gross fixed capital formation—reflecting investment in the economy—decreased by 0.2%. This has been a significant worry on the minds of economists and analysts looking at the health of the economy.
Net exports also contributed negatively (-1.1 percentage points) to expenditure on GDP.
Exports of goods and services increased by 0.9%, largely influenced by increased trade in pearls, precious and semi-precious stones and precious metals; chemical products; live animals and products; and paper and articles of paper.
However, the imports of goods and services increased by 4.9%, largely influenced by increased trade in machinery and electrical equipment, mineral products, chemical products, and artificial resins and plastics.

















 Loading ...