Traffic fine hot spots in South Africa

Information from open-data group, CodeSA, shows which regions in South Africa are hot spots for big fines over the holiday period.
The information is based on data from the 2014 financial year, in which over R1 billion in fines were collected by municipalities in the country.
Municipalities are required by law to source their own revenues – and one of the ways to accomplish this is through traffic fines.
As the most populous region in the country, it’s no surprise that Gauteng municipalities brought in the most fines in 2014 (over R360 million); however, CodeSA’s data shows Gautend isn’t the most heavy-handed when it comes to issuing fines.
To identify which areas are particularly heavy-handed when it comes to fining, one needs only to look at fine revenue expressed as a percentage of total revenue made by municipalities.
The national average for fines as a percentage of total revenue is 0.4%, and 61 municipalities across the country – mostly from the Western Cape and KwaZulu Natal – hit higher than this.
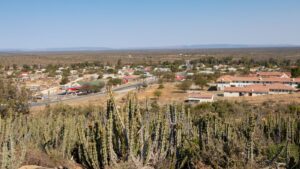
According to CodeSA data, the Ubuntu municipality in the Northern Cape – which is passed by travellers on their way to Cape Town – is the biggest culprit here.
In the 2014 financial year, the municipality made R15.9 million from fines – which is a staggering 25.6% of its total revenue made in that year.
This is more than double the second biggest culprit – Laingsburg municipality in the Western Cape – which sources 10.7% of its total revenue through traffic fines.
| # | Municipality | Province | Route | Fine Revenue (R’000) | % of total Revenue |
|---|---|---|---|---|---|
| 1 | Ubuntu | NC | N1 | 15 911 | 25.6% |
| 2 | Laingsburg | WC | N1 | 3 704 | 10.7% |
| 3 | Mthonjaneni | KZN | R66 | 3 253 | 5.4% |
| 4 | Beaufort West | WC | N1 | 10 910 | 5.2% |
| 5 | Ventersdorp | NW | N14 | 5 457 | 4.1% |
| 6 | uMngeni | KZN | N3 | 8 629 | 3.5% |
| 7 | Theewaterskloof | WC | N2 | 11 375 | 3.4% |
| 8 | The Big Five False Bay | KNZ | N2 | 864 | 2.6% |
| 9 | Prince Albert | WC | N1 | 948 | 2.6% |
| 10 | Knysna | WC | N2 | 11 551 | 2.2% |
| 11 | Stellenbosch | WC | N1 / R44 | 22 412 | 2.2% |
| 12 | Swellendam | WC | N2 | 3 597 | 2.2% |
| 13 | Bela-Bela | LP | N1 | 2 392 | 2.2% |
| 14 | Kgetlengrivier | NW | N4 | 2 082 | 2.2% |
| 15 | Midvaal | GP | R59 | 13 363 | 2.1% |
| 16 | Breede Valley | WC | N1 | 13 685 | 2.1% |
| 17 | Ulundi | KZN | R66 | 3 397 | 2.0% |
| 18 | Bitou | WC | N2 | 8 196 | 2.0% |
| 19 | Emthanjeni | NC | N10 | 3 012 | 1.8% |
| 20 | Swartland | WC | N7 | 6 348 | 1.6% |
Holiday targets
Half of the top 20 municipality who fine the hardest are found in the Western Cape, with four found in KwaZulu-Natal, two in the North West, two in the Northern Cape and one each in Gauteng and Limpopo.
All of these regions are either popular holiday destinations, or are on the routes that lead to popular holiday destinations – adding credence to the claim that municipalities fine holiday travellers hardest.
The routes where you’re most likely to be hit hardest with fines are national routes in the Western Cape (N1, N2, N10 and N7), as well as national routes leaving Gauteng to Durban (N3), Bela-Bela (N1) and the North West (N4 and N14).
Local (regional) routes are also fined heavily, particularly the R66 in KwaZulu-Natal, and the R44 outside Stellenbosch. The R59 in Gauteng on the way to the Vaal is also one of the most fined regions.
These are the major towns along these routes:
Northern Cape
- Richmond (N1)
Western Cape
- Beufort West (N1)
- Laingsburg (N1)
- Kruidfontein (N1)
- Worcester (N1)
- Stellenbosch (N1 / R44)
- Knysna (N2)
- Caledon (N2)
- Plettenburg Bay (N2)
- De Aar (N10)
KwaZulu-Natal
- Howick (N3)
- Melmoth (R66)
- Ulundi (R66)
North-West Province
- Outside Rustenburg (N4)
- Ventersdorp (N14)
Limpopo
- Bela-Bela (N1)
Gauteng
- Meyerton (R59)
It is interesting to note that most of the heavy fine municipalities are run by the Democratic Alliance, which has been vocal about its position on reducing dangerous driving.
More on traffic
Cape Town’s R750 million plan to fight traffic congestion