Black vs white household spending in South Africa

While tough economic conditions have put pressure on all households across all races and income groups, data from the Institute or Race Relations shows that white households are by far still the best off in the country.
The data is contained in a research report from the IRR in 2015, showing consumer expenditure trends among South Africans, broken down by expenditure level and race.
The breakdown reveals massive levels of inequality, where almost two-thirds (61%) of white households fall into the highest level of monthly expenditure (R10,000+), compared to only 8% of black households, and 20% of coloured and 43% of Asian/Indian households.
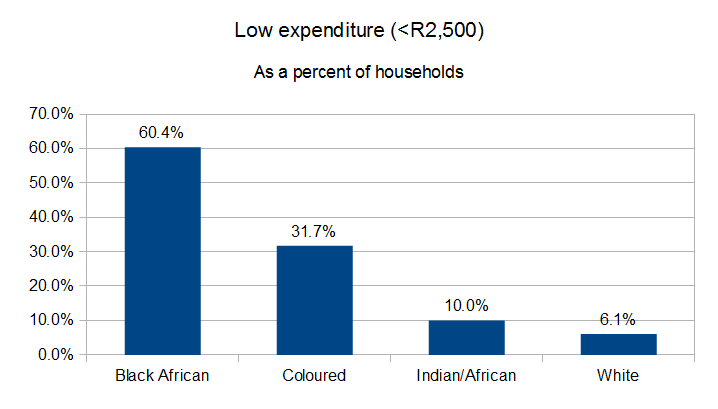
Conversely, the majority of black African households (60%) are spending under R2,500 a month, compared to just 6% of white households, 32% of coloured households and 10% of Asian/Indian households.
| Expenditure | Black African | Coloured | Indian/African | White |
|---|---|---|---|---|
| R0 – R399 | 626 000 | 21 000 | * | * |
| R400 – R799 | 1 244 000 | 40 000 | * | * |
| R800 – R1 199 | 1 815 000 | 64 000 | 6 000 | 27 000 |
| R1 200 – R1 799 | 2 013 000 | 92 000 | 13 000 | 34 000 |
| R1 800 – R2 499 | 1 851 000 | 137 000 | 17 000 | 37 000 |
| R2 500 – R4 999 | 2 299 000 | 273 000 | 52 000 | 128 000 |
| R5 000 – R9 999 | 1 315 000 | 245 000 | 83 000 | 302 000 |
| R10 000+ | 1 012 000 | 222 000 | 154 000 | 988 000 |
| Unspecified | 330 000 | 21 000 | 34 000 | 93 000 |
| Total housholds | 12 506 000 | 1 116 000 | 361 000 | 1 619 000 |
* Numbers under 10,000 are too small to provide estimates
The following graphs show the differences between the lower (<R2,500), middle (R2,500-R10,000) and upper (R10,000+) levels of monthly spending among South Africa’s 15.6 million households, across race groups.


According to the Pietermaritzburg Agency for Community Social Action (Pacsa), the average household in South Africa comprises 5 family members (a mix of children, adults and the elderly), shooting up to 7 members in black households.
To feed a family of 5 the bare minimum in August 2016, it costs R1,942 – in August 2015 (aligning with the IRR’s data), the amount was R1,624.
To feed a family of 5 a nutritionally complete basket of food (the minimum recommended for healthy living), it would cost R3,126 – and R4,325 for a family of 7.
However, in terms of South Africa’s rising black middle class, updated figures showed that this segment has more than trebled over the past 12 years, while the country’s white middle class has shrunk over the same period.
City Press reported that the black middle class is up to 5.81 million, citing University of Cape Town marketing professor, John Simpson.
According to Simpson, factors driving the surge include greater access to credit, improved education levels, BEE and improved economic growth until recently. He noted that since 2004, the number of black middle class members with a tertiary qualification has grown by more than 2 million.

More on finances
Pacsa says you should pay your domestic worker R8,000 a month – minimum
This is how much it now costs to feed a family of 5 in South Africa
How a R4,000 South African minimum wage compares to the rest of the world
A R4,000 minimum wage will kill jobs and make people poorer: economist