

How much money municipalities make from traffic fines in SA


Stats SA has released the latest financial census of South African municipalities, showing exactly how the country’s major metros have been getting and spending their money in the last financial year.
According to the stats group, total operational revenue for municipalities came to R351.4 billion, while expenses came to R331.3 billion. However, debt increased 6.8% to R225.8 billion.
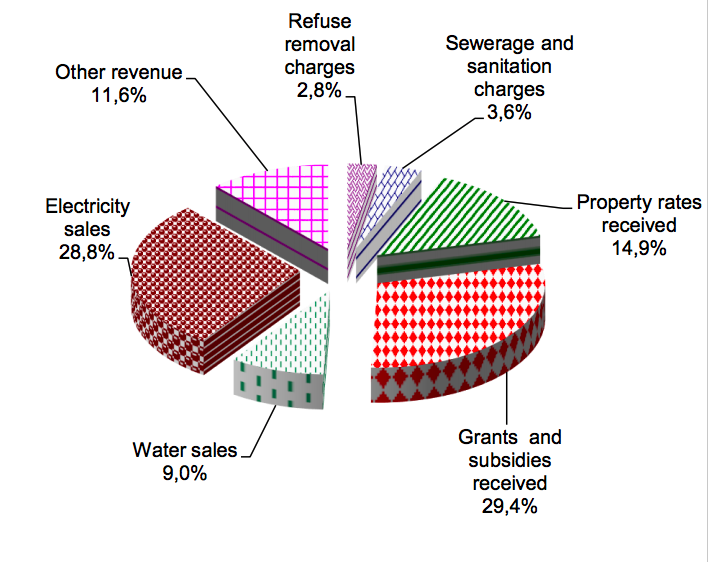
For the year, the largest contributor to municipal revenue of was grants and subsidies received (29.4%), followed by electricity sales (28.8%), property rates received (14.9%), other revenue (11.6%) – which consists of fines, licences and permits, public contributions and donations, etc – water sales (9.0%), sewerage and sanitation charges (3.6%), and refuse removal charges (2.8%).
Fines pulled in over R4.7 billion for municipalities in 2017 – the bulk of which were listed under ‘traffic control’, which accounted for almost R4.1 billion in 2017 (down from the R4.2 billion collected from traffic fines in the previous year.)
Licences and other permits brought in R744 million in revenue, most of which was listed under the transport sector (R378 million).
Expenditure and debt
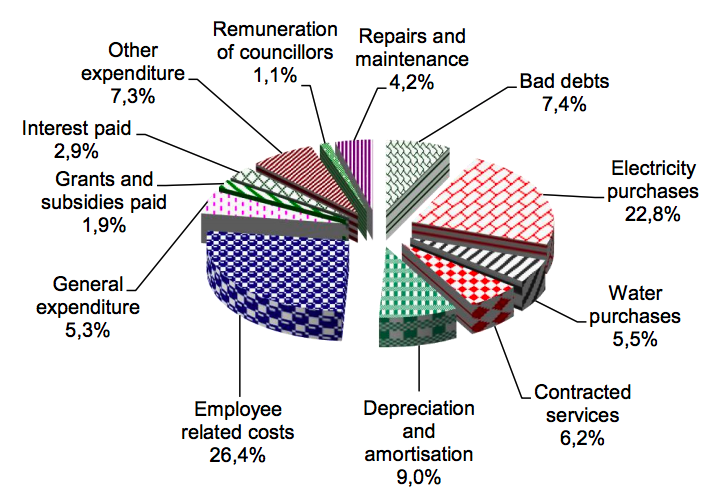
As with previous years, and reflecting national trends, the largest contributor to municipal total operating expenditure (total expenditure less deficit and rebates) were employee-related costs (26,4%) which totalled over R87.5 billion.
This was followed by electricity purchases (22.8%), depreciation and amortisation'(9,0%), bad debts (7.4%), ‘other expenditure’ (7.3%) (which consists of collection costs, loss on disposal of property, plant and equipment, impairment loss, etc.). The spending portions are detailed in the graphic below:
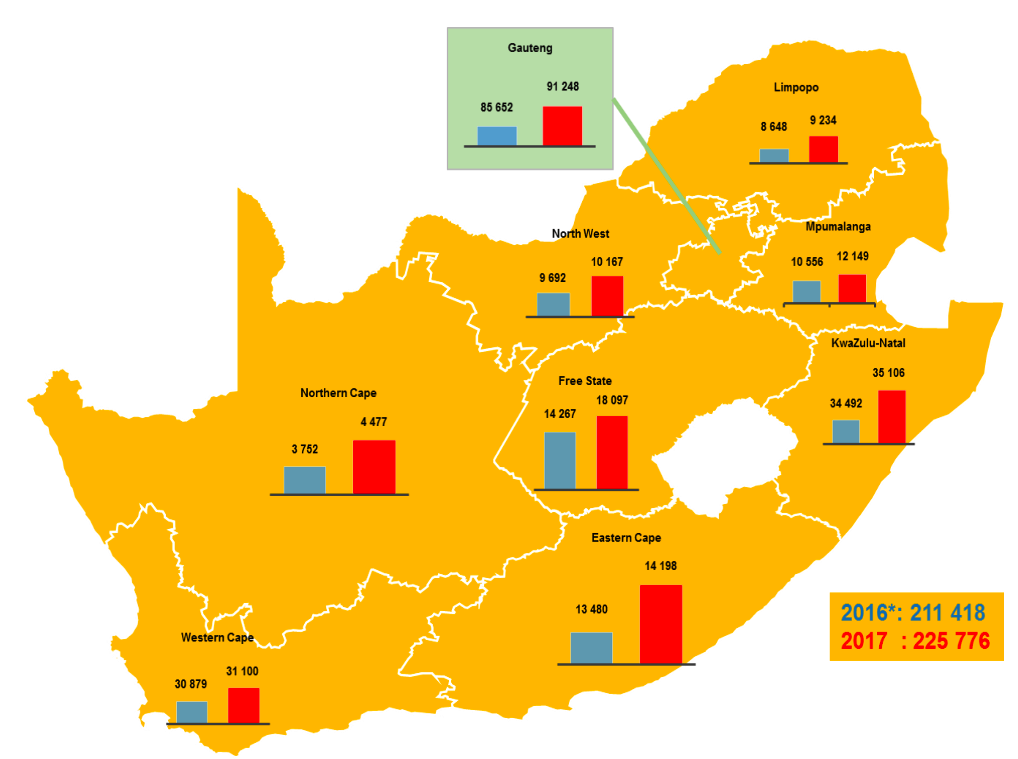
As at 30 June 2017, municipalities owed their lenders, suppliers and other creditors a combined amount of R225.8 billion – 6.8% more than what they owed as at 30 June 2016.
The provinces which showed the highest increases between 2016 and 2017 were Free State (26.8%), Northern Cape (19.3%), Mpumalanga (15.1%) and Limpopo (6.8%).
The provinces which had the lowest percentage increases between 2016 and 2017 were Western Cape (0.7%), KwaZulu-Natal (1.8%), North West (4.9%) and Eastern Cape (5.3%).
Read: Over R850 million worth of fines to be written off: report











 Loading ...