South Africa’s R60 billion traffic congestion bill

TomTom has published its fourth annual global traffic index, showing that Cape Town is now ranked as the most congested city in South Africa.
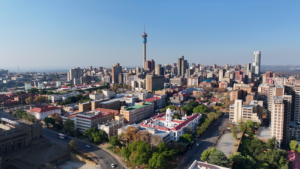
The Mother City overtakes Johannesburg, which topped the list in the 2013 report.
South Africa has an overall congestion level of 21%, the report said.
The index uses road traffic data collected from TomTom users around the globe, which is analysed to draw conclusions about the traffic situation in large cities.
It showed that congestion on secondary roads is worse than main roads in South Africa and that commuters are spending an average of 10 working days a year stuck in traffic.
According to Stats SA’s Quarterly Employment Survey, the country’s 8.5 million employed workers earn an average of R14,911 per month (December 2013) – or R710.04 per day (calculated on a 21-day work month).
Projected onto TomTom’s estimation, this means that the average South African wastes R7,100 sitting in traffic every year.
Further, that means over R60.35 billion rand is potentially lost to the economy in productivity, if every one of the 8.5 million working South Africans loses 10 days sitting in traffic every year.
The traditional responses to congestion, such as building new roads or widening existing ones, are no longer proving to be effective, TomTom said.
“This is creating a new set of challenges for local authorities looking for solutions to the increasing traffic problem,” the location and navigation products and services provider said.
It also turns out that shortcuts drivers take to avoid congestion are actually “longcuts”, according to TomTom, adding 50% more travel time to journeys.
South Africa is also the only country in the world measured by TomTom to experience its worst congestion on a Monday morning while most of the world experiences the worst congestion on a Tuesday morning.
The table below summarises the standings of the South African cities whose congestion levels are tracked by TomTom:
| City | Congestion | Global ranking |
| Cape Town | 27% | 33 |
| Johannesburg | 25% | 48 |
| East London | 22% | 65 |
| Pretoria | 22% | 73 |
| Durban | 18% | 98 |
| Bloemfontein | 12% | 134 |
TomTom summarised the results of its congestion index for South Africa as follows:
- South Africans spend on average an extra 13 minutes per hour stuck in traffic.
- South Africans are spending an average of 10 working days a year stuck in traffic.
- Cape Town experiences the most congestion during morning peak periods with a congestion level of 71%.
- Cape Town also experiences the worst evening peak congestion period with a level of 58%.
- All South African cities, except for East London, experience worst congestion during the morning peak periods than during the evening peak periods.
- Bloemfontein experiences the least congestion with a level of 24% during morning peak periods and 22% during evening peak periods.
- East London experiences the same amount of congestion during morning and evening peak periods at a level of 47%.
- Each South African city experiences more congestion on secondary roads than on highways.
- Cape Town and Johannesburg share the same amount of congestion levels on their secondary roads with a level of 30%.
- Joburgers on average will cut their delay time caused by congestion in half if they take the highway as opposed to a secondary road.
- Congestion on secondary roads in Pretoria is three times the amount on its highways.
- On average, Capetonians will save 6 minutes for every hour during peak periods if they take the highway.
- The report measures over 95,000km of roadways in South Africa.
- The best morning peak days fall on a Friday for South Africans unless you live in Cape Town or Bloemfontein, then your best morning would be on a Thursday.
- Johannesburg and East London both experience less congestion in both morning and evening peak times on a Friday
- On the 8 March 2013 Cape Town experienced 29mm of rain. This was also the city’s most congested day, according to the report.
For the sake of comparison, here are the top 10 most congested cities in the world along with their congestion levels:
| # | City | Congestion |
| 1 | Moscow | 74% |
| 2 | Istandbul | 62% |
| 3 | Rio de Janeiro | 55% |
| 4 | Mexico City | 54% |
| 5 | Sao Paulo | 46% |
| 6 | Palermo | 39% |
| 7 | Warsaw | 39% |
| 8 | Rome | 37% |
| 9 | Los Angeles | 36% |
| 10 | Dublin | 35% |
More on South Africa
South Africa’s massive wage gap
South Africa’s city of opportunity