There were fewer protests in 2016 – but nearly all of them were violent

Specialised local government data and intelligence organisation, Municipal IQ, has released its municipal protest analysis for 2016.
Muncipal IQ collects data on service delivery protests staged against municipalities on its Municipal Hotspots Monitor in order to quantify and better understand the ongoing nature and trends behind such events.
The report shows that service delivery protests in 2016 were lower than any year since 2011 – the last year in which local government elections were held.
Karen Heese, economist at Municipal IQ, argued that this tailing-off in service delivery protests in 2016, especially in the months around and following elections, was a “positive endorsement of local democracy suggesting that communities still have confidence in the ballot box as a superior alternative to street protests”.
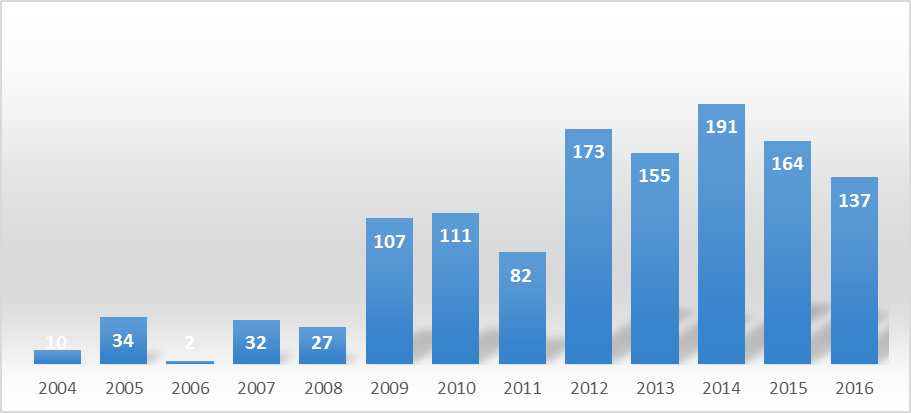
Nonetheless, a noteworthy feature of 2016’s protests were their violent nature.
Heese noted that violent protests had increased from 75% of all service delivery protests between 2004 and 2016 to 86% in 2016. This means that while there were fewer service delivery protests, those that occurred were more violent.
Municipal IQ MD Kevin Allan noted that in terms of provincial representation Gauteng was the most prominent site of service delivery protests in 2016, followed by the Eastern Cape and KwaZulu-Natal.
Read: Icasa lays criminal charges against SABC over protest policy