These 3 charts hint at your home’s worth in the current economy

New FNB data provides an indication on the number of homes being resold at values below their previous purchase price in recent months amid renewed economic weakness.
The FNB House Price Index for June 2017 rose by 3.6% year-on-year, up a fraction from the revised 3.3% rate recorded for May.
Examining house price growth on a month-on-month basis, FNB pointed to some slowing in growth in April, May and June. “This renewed slowing ties in with the FNB second Quarter Estate Agent Survey which has seen activity levels slip once more as well as a renewed increase in average time of homes on the market, said FNB property analyst John Loos.
In real terms, when adjusting for consumer Price Index inflation, FNB said that the rate of house price growth was down (-2.0%) year-on-year in May, after a revised -2.1% in April.
The average price of homes transacted in June was R1,102,190, FNB said.
The lender said that looking at house price growth on a month-on-month seasonally-adjusted basis suggests that a period of renewed economic weakness may once again be emerging after the first quarter of 2017 had shown certain signs that a slightly stronger economy may be approaching.
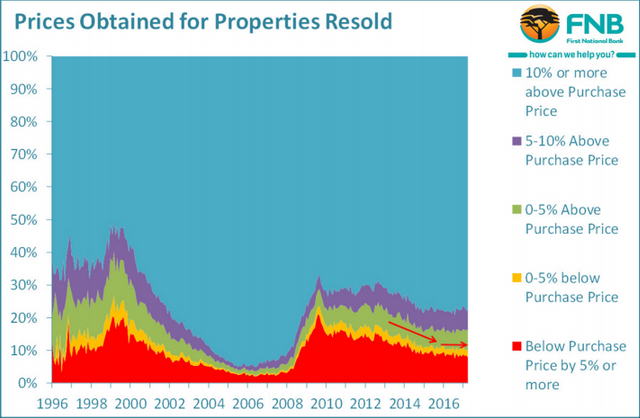
“Firstly, what we see is that the percentage of homes being resold for 10% or more above purchase price has begun to decline slightly, from a post-2008/9 recession high of 78.3% for the 6 months to August 2016 to 77.2% for the 6 months to May 2017,” Loos said.
“So, while there is no noticeable rise in the incidence of price deflation yet, the rate of price inflation on home resales may to be starting to slow.”
He said that as the level of pricing power diminishes, there has been an increase in the estimated percentage of homes being resold at values nearer to their previous purchase price.
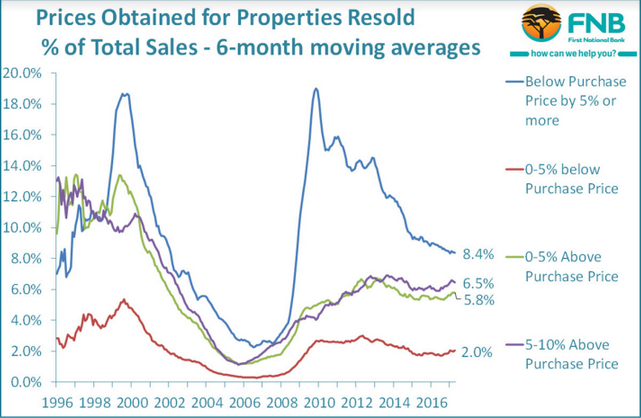
Homes resold at 5-10% above purchase price have seen a slight increase from 5.9% of total sales for the first 6 months of 2016 to 6.5% for the 6 months to May 2017.
Homes resold at 0-5% of original purchase price have risen from 5.3% of total sales for the 6 months to September 2016, to 6% for the 6 months to May 2017.
“Then, there has been some increase in the incidence of price deflation in the “homes resold at 0-5% below purchase price” band. From 1.69% of total resales for the 6 months to July 2017, the percentage of homes falling into this deflation category has risen mildly to 2.1% of total sales,” Loos said.
However, in the category homes resold at more than 5% below purchase price, there has not yet been a noteworthy rise in the percentage of total resales. The estimated percentage for this category was 8.3% for the 6-months to May, slightly lower than the 8.7% for the 1st half of 2016 and 8.5% for the second half of 2016, the analyst said.

FNB said that while there has not yet been any noticeable rise in all out home resales deflation, it has noted a rise in the estimated percentages in those price inflation/deflation categories nearer to original purchase price level, and a decline in the estimated percentage of homes being resold at 10% or more than purchase price.
“This suggests that, while sellers as a group have been able to resist greater levels of overall resales price deflation – albeit by often having to leave their homes on the market for longer to achieve their price – their average pricing power appears to have weakened mildly,” Loos said.
Read: House prices vs income in South Africa’s major regions