3 graphs that show how government is really spending your tax money

Indicative of an economy under strain, expenditure by general government increased by just 4.7% from 2015/16 to 2016/17.
This is according to a new report by Stats SA, which notes that this is the lowest annual rise in spending on record since 2005/06 – when it first started publishing the data.

The report notes that there are currently 704 institutions that make up general government.
This includes all national and provincial government departments, municipalities, extra-budgetary accounts and higher education institutions.
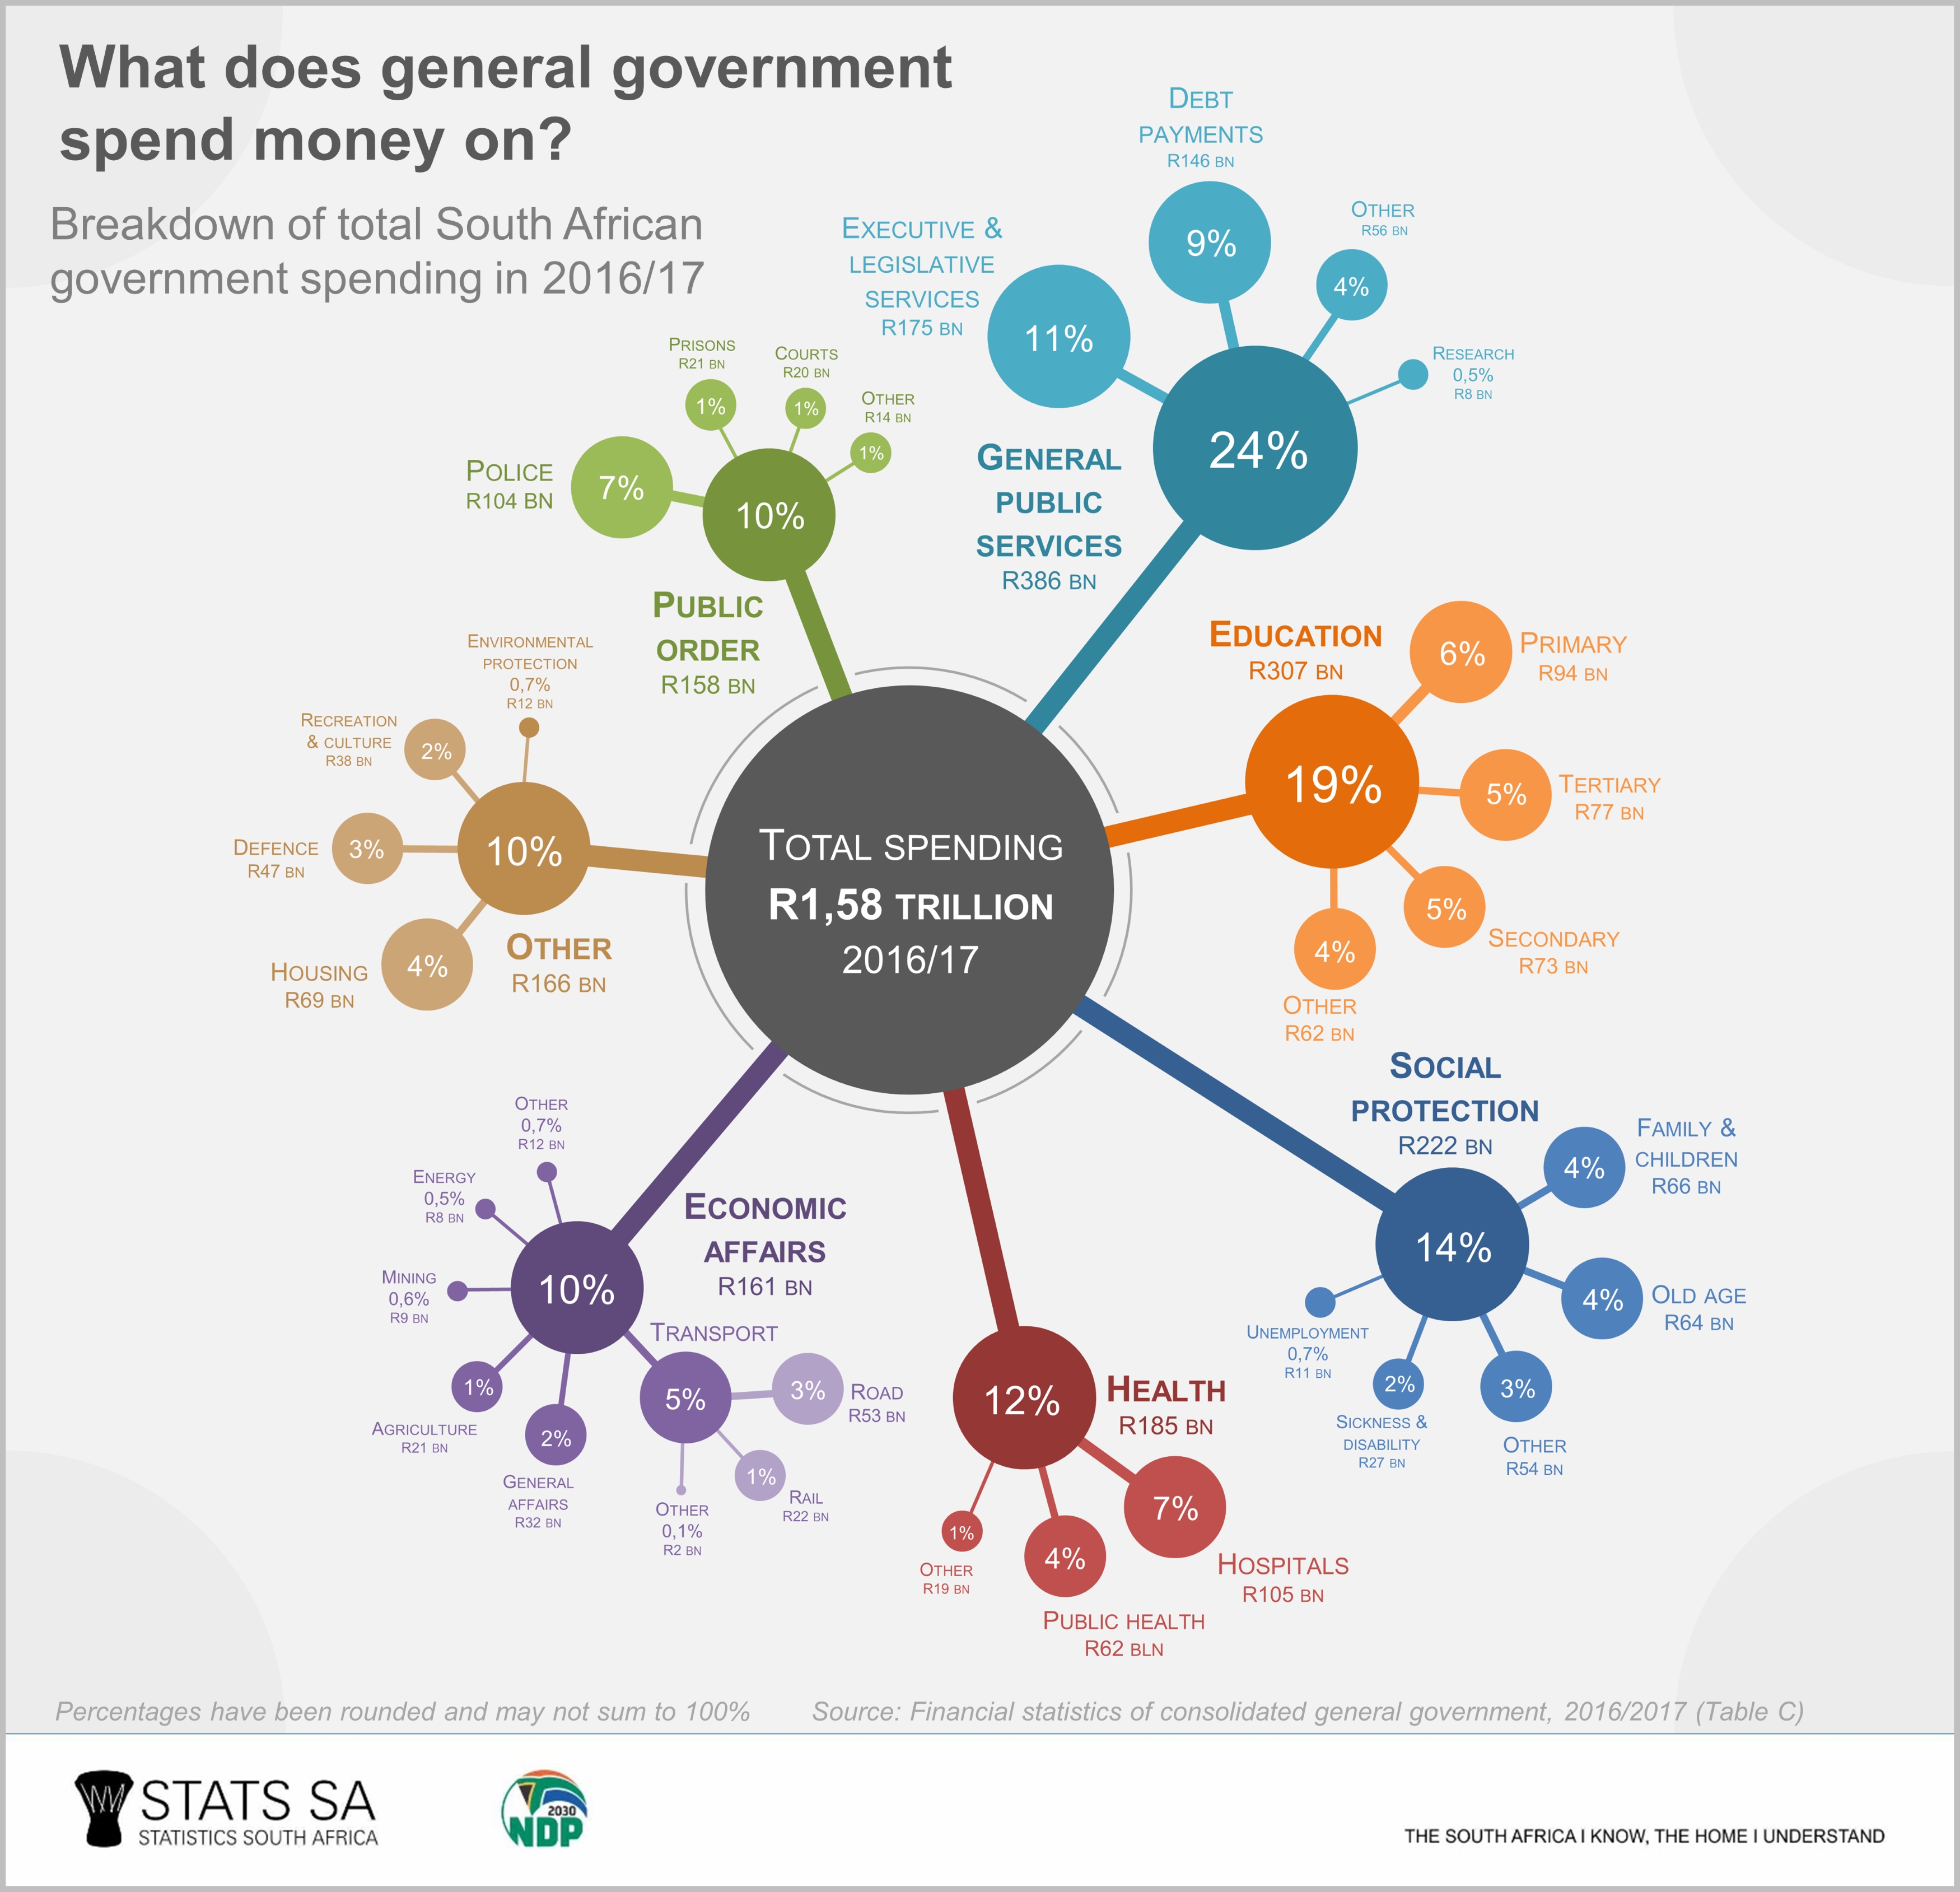
As a whole, general government spent R1.58 trillion in 2016/17 – higher than the R1,51 trillion recorded in 2015/16 – with a 3.1% fall in capital expenditure contributing to the slower growth in overall spending, Stats SA said.
“This mirrors a similar result published in Stats SA’s recent capital expenditure by the public sector release, which reported a pull-back in spending on capital expenditure throughout the public sector in 2017.
“The bulk of general government expenditure was on the following four functions: general public services (24%); education (19%); social protection (14%); and health (12%),” it said.
Unpacking some of the expenditure on other functions, it is evident that more money was spent on police services (R104 billion) than on housing (R69 billion) in 2016/17, Stats SA said.
“Payments on public debt, under general public services, totalled R146 billion or 9% of total expenditure, higher than the amount spent on hospital services (R105 billion) or tertiary education (R77 billion).”
Another way to analyse government spending is to express it in economic terms, which provides insight into how much money was paid towards items such as goods, services, and salaries, Stats SA said.
“Compensation of employees, which includes salaries and wages earned by civil servants, took up the lion’s share (42%) of total expenses. This was followed by purchases of goods and services, social benefits, and interest paid.

“Compensation of employees, purchases, interest, subsidies and social benefits increased in 2016/17 compared with 2015/16.
“The general government’s wage bill increased by 8% (or R44 billion), with an increase of 8% for national government, 8% for provincial government, 9% for extra-budgetary institutions, and 9% for higher education institutions.
“However, there was a fall in spending on grants paid and other payments. Government transferred less money to the Southern African Customs Union (SACU) in 2016/17 compared with 2015/16 as a result of lower customs duties, contributing to the fall in grants paid.”
Read: Gordhan points to ‘tender inflation’ at state-owned entities