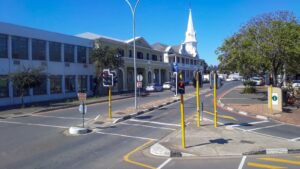
How South Africa’s petrol price compares to the rest of the world

Motorists around the world are facing the effects of increasing fuel prices according to Bloomberg’s latest Gasoline Index, which focused on global petrol prices over the course of the second quarter of 2018.
The index includes data from 61 countries, and the information is sorted by average fuel price, affordability, and the percentage of a day’s wages needed to buy a unit of petrol.
Bloomberg found that petrol prices are soaring around the world – about 6%, on average, in the past three months and 15% over the past year. Behind that increase is a wide range of price swings experienced differently by every nation.
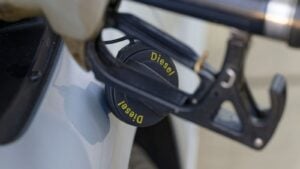
Despite not having the most expensive petrol in the world at R16.03 for a litre of 95 petrol, Bloomberg said that South Africa’s other economic issues meant it is now one of the most expensive places in the world to be a motorist.
“South Africans face a lot of pain at the pump, exacerbated by how little income they earn,” Bloomberg said. “They now spend more of their paycheques filling up than any other nation except Mexico.”
The prices below are not adjusted for purchasing price parity.
Most expensive petrol in the world
| # | Country | Price per Litre |
|---|---|---|
| 61 | Hong Kong | R28.44 |
| 60 | Norway | R27.41 |
| 59 | Netherlands | R26.15 |
| 58 | Greece | R25.96 |
| 57 | Italy | R25.94 |
| 56 | Denmark | R25.74 |
| 55 | Israel | R25.33 |
| 54 | Portugal | R24.81 |
| 53 | Finland | R24.27 |
| 52 | France | R24.22 |
Petrol prices as a % of daily wage
This category refers to the portion of daily wages that would be needed to buy a litre of petrol.
Bloomberg found that South Africa is one of the worst countries in the world when it comes to the affordability of petrol when it comes to daily wages (57th).
With an average daily income of R237.13, it takes 6.53% of a day’s wages to afford a litre of petrol in South Africa – compared to just 1.16% in Denmark and 1.36% in the Netherlands – which would explain their perceived high prices.
| # | Country | % of average daily wage |
|---|---|---|
| 61 | India | 20.49% |
| 60 | Pakistan | 19.07% |
| 59 | Philippines | 12.44% |
| 58 | Nigeria | 8.00% |
| 57 | South Africa | 6.53% |
| 56 | Indonesia | 6.26% |
| 55 | Egypt | 6.21% |
| 54 | Thailand | 5.71% |
| 53 | Bulgaria | 5.46% |
| 52 | Turkey | 5.19% |
Petrol prices as a % of annual income
This refers to the portion of annual income spent on fuel purchases.
According to Bloomberg, the average South African driver uses 202.07 litres a year, which eats up 3.62% of the typical South African’s annual salary.
This is behind only Mexico, where motorists spend around 3.94% of their average annual salary on petrol.
| # | Country | % of average annual income |
|---|---|---|
| 61 | Mexico | 3.94% |
| 60 | South Africa | 3.62% |
| 59 | Canada | 3.01% |
| 58 | Greece | 2.95% |
| 57 | Saudi Arabia | 2.87% |
| 56 | Brazil | 2.80% |
| 55 | New Zealand | 2.56% |
| 54 | Malaysia | 2.56% |
| 53 | Cyprus | 2.30% |
| 52 | Russia | 2.20% |
Neighbouring countries
One of the more interesting comparisons to make is how much petrol South Africa pays compared to its neighbouring countries
For example the cost of petrol in Botswana was just R10.72 at the end of July, while it would cost you around R12.84 for a litre in Swaziland.
Below are the latest comparisons as of 30 July 2018.
- Botswana – R10.72
- Kenya – R15.18
- Lesotho – R11.13
- Mauritius – R19.24
- Mozambique – R15.33
- Namibia – R12.35
- South Africa – R16.02
- Swaziland – R12.84
- Zimbabwe – R15.73
Read: Expect a much bigger petrol price hike in September: Dawie Roodt