Fastest growing cities in South Africa

Data from the United Nations shows which South African cities have experienced the biggest growth spurt over the past 65 years, and what these cities will look like in 2030.
Earlier this year, Stats SA reported that South Africa’s most populous province, Gauteng had breached a population of 13 million people.
Of all South African cities, Johannesburg is the largest, as it has been since 1950, when the population was just over 1.65 million people.
The UN’s data shows that in 2015, over 9 million people are estimated to live in and around Joburg – and that by 2030, this is projected to grow to over 11.5 million people, making it the 34th biggest city in the world.
Read: SA population flocking to cities
However, when it comes to population growth within South African cities, Johannesburg has not experienced the biggest boom.
The UN’s data for 1950 shows that Johannesburg’s population of 1.65 million people had increased by 470% to 9.4 million by 2015.
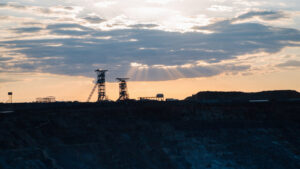
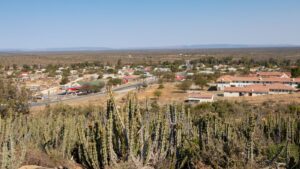
Operating from a smaller base, Soshanguve, a major settlement north of Pretoria, has grown from 24,000 people in 1950 to 775,000 in the same time – a rise of 3,100%.
Rustenburg (2,635%) and Witbank (2,370%) have seen similar jumps since the 1950s.

SA city population (click to enlarge)
SA city population growth, 1950 – 2015
| City | 1950 Population | 2015 Population | Growth (%) |
|---|---|---|---|
| Soshanguve | 24 000 | 775 000 | 3 129% |
| Rustenburg | 14 000 | 383 000 | 2 636% |
| Witbank | 15 000 | 371 000 | 2 373% |
| Vereeniging | 117 000 | 1 155 000 | 887% |
| Pretoria | 275 000 | 2 059 000 | 649% |
| Port Elizabeth | 192 000 | 1 179 000 | 514% |
| Durban | 484 000 | 2 901 000 | 499% |
| Cape Town | 618 000 | 3 660 000 | 492% |
| Johannesburg | 1 653 000 | 9 399 000 | 469% |
| Pietermaritzburg | 90 000 | 495 000 | 450% |
| Bloemfontein | 107 000 | 503 000 | 370% |
| East London | 89 000 | 319 000 | 258% |
South Africa’s population has grown from around 13 million to 54 million over the past 65 years.
Looking at the period after the fall of apartheid shows a more representative model of city growth, as movements of the biggest portion of the population became less restricted (though economic restrictions still persist).
SA city population growth, 1995 – 2015
| City | 1995 Population | 2015 Population | Growth (%) |
|---|---|---|---|
| Rustenburg | 75 000 | 383 000 | 411% |
| Witbank | 156 000 | 371 000 | 138% |
| Pretoria | 951 000 | 2 059 000 | 117% |
| Johannesburg | 4 529 000 | 9 399 000 | 108% |
| Soshanguve | 472 000 | 775 000 | 64% |
| Bloemfontein | 317 000 | 503 000 | 59% |
| East London | 204 000 | 319 000 | 56% |
| Cape Town | 2 394 000 | 3 660 000 | 53% |
| Vereeniging | 800 000 | 1 155 000 | 44% |
| Durban | 2 081 000 | 2 901 000 | 39% |
| Pietermaritzburg | 356 000 | 495 000 | 39% |
| Port Elizabeth | 911 000 | 1 179 000 | 29% |
The UN’s projections through to 2030 show that population growth is expected to continue in these top areas – where Rustenburg is forecast to grow to a population of 540,000 people.
SA city population growth, 2015 – 2030
| City | 2015 Population | 2030 Population (Est.) | Growth (%) |
|---|---|---|---|
| Rustenburg | 383 000 | 544 00 | 42% |
| Witbank | 371 000 | 512 000 | 38% |
| Pretoria | 2 059 000 | 2 701 000 | 31% |
| East London | 319 000 | 397 000 | 24% |
| Bloemfontein | 503 000 | 623 000 | 24% |
| Johannesburg | 9 399 000 | 11 573 000 | 23% |
| Soshanguve | 775 000 | 935 000 | 21% |
| Pietermaritzburg | 495 000 | 588 000 | 19% |
| Vereeniging | 1 155 000 | 1 370 000 | 19% |
| Cape Town | 3 660 000 | 4 322 000 | 18% |
| Port Elizabeth | 1 179 000 | 1 390 000 | 18% |
| Durban | 2 901 000 | 3 349 000 | 15% |
More on population
What South Africa’s population will look like in 2050