

From bad to worse for unemployment in South Africa


Stats SA has published the latest unemployment data, showing another significant climb in the unemployment rate.
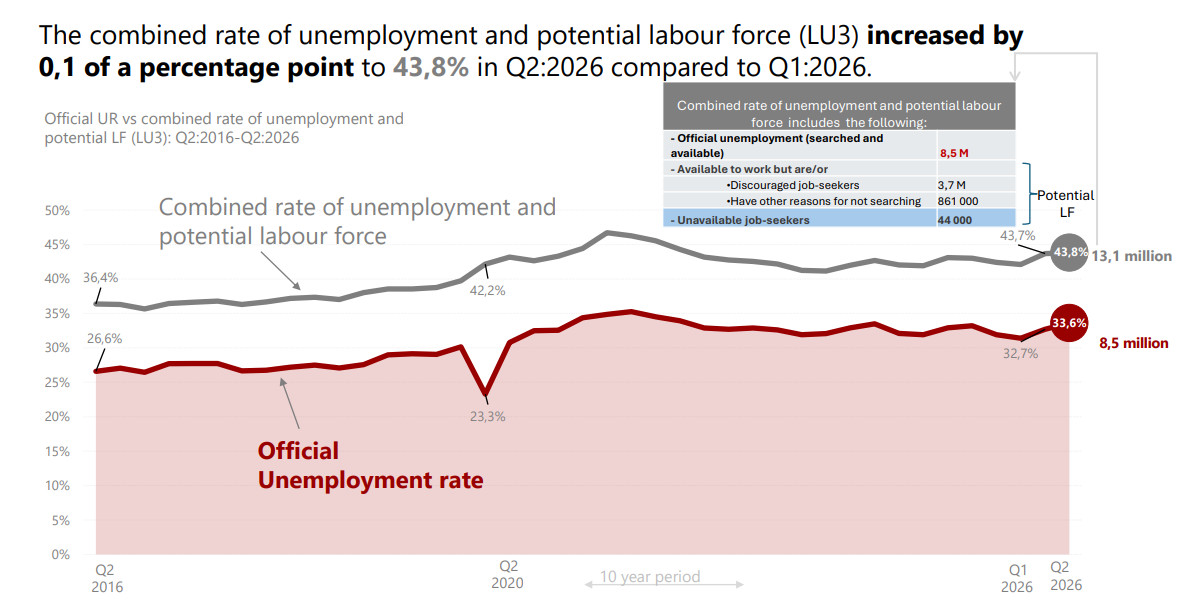
According to the Quarterly Labour Force Survey for the second quarter of the year, South Africa’s unemployment rate has increased by 0.9 percentage points to 33.6%.
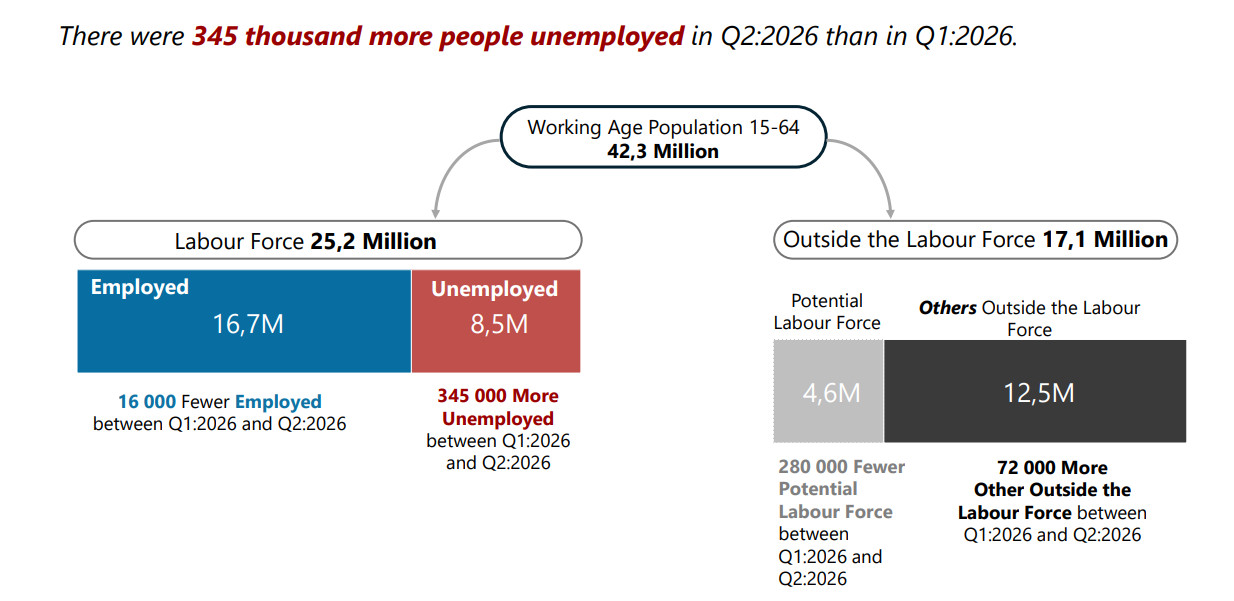
Between April and June 2026, there was an increase of 345,000 in the number of unemployed persons to 8.5 million, while there was a decrease of 16,000 in the number of employed persons to 16.7 million.
This resulted in an increase of 329,000 in the labour force during the same period.
The changes in employment and unemployment resulted in the official unemployment rate increasing by 0.9 percentage points from 32.7% in the first quarter of 2026 to 33.6% in the second quarter of 2026.
Discouraged job-seekers decreased by 227,000 to 3.7 million, other available job-seekers decreased by 49,000 to 861,000, and unavailable job-seekers decreased by 4,000 to 44,000.
This resulted in a net decrease of 280,000 to 4.6 million in the potential labour force (i.e. persons who were available but not seeking or unavailable but seeking).
Those outside the labour force for other reasons increased by 72,000 to 12.5 million.
Persons outside the labour force, which is the total of those in the potential labour force and others outside the labour force, decreased by 208,000 to 17.1 million in the second quarter of 2026.
In terms of the expanded definitions of unemployment, the key figure that is comparable to previous versions of the QLFS is the combined rate of unemployment and potential labour force.
This figure increased by 0.1 of a percentage point to 43.8%.
The composite measure of labour underutilisation—which combines time-related underemployment, unemployment and potential labour force as a proportion of extended labour force—remained unchanged at 46.3% in the second quarter of 2026.
Hardest hit sectors
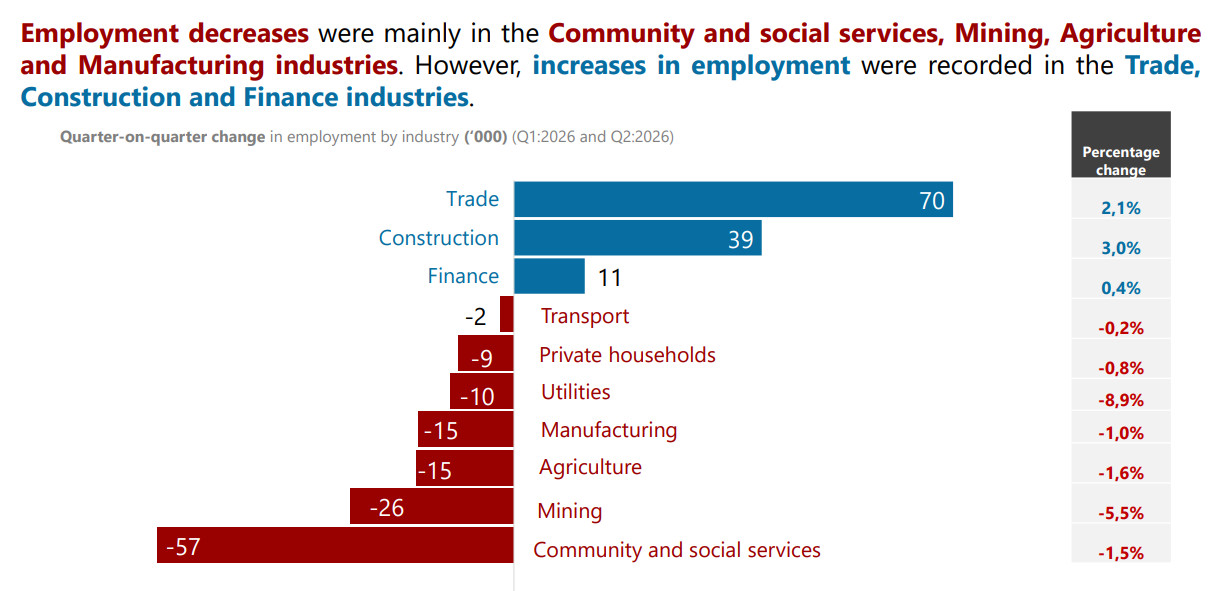
The number of employed persons decreased in seven of the ten industries.
The largest decreases in employment were recorded in the Community and social services industry (57,000), followed by the Mining industry (26,000), Agriculture and Manufacturing (15,000 each), and Utilities (10,000).
Increases in employment were recorded in Trade (70,000), followed by Construction (39,000) and Finance (11,000) industries.
Compared with the same period last year, a net decrease of 68,000 in total employment was largely due to decreases in the number of persons employed in the Community and social services (101,000), Manufacturing (100,000), Utilities (36,000) and Finance (33,000) industries.
Gains in employment were recorded in Construction (94,000), followed by the Trade (74,000), Agriculture (39,000) and Mining (16,000) industries.


















 Loading ...