South Africans are getting poorer – how we lost R336 billion in a year

Over the last year, South African households got poorer as stagnant economic growth and stubbornly high inflation stoked higher living costs, and inflation ate away any gains.
The latest Momentum/Unisa Household Wealth Index shows that even though South African households’ wealth increased over the past year, rising interest rates, persistent load-shedding, and declining world economic growth rates put pressure on households, increasing household liabilities.
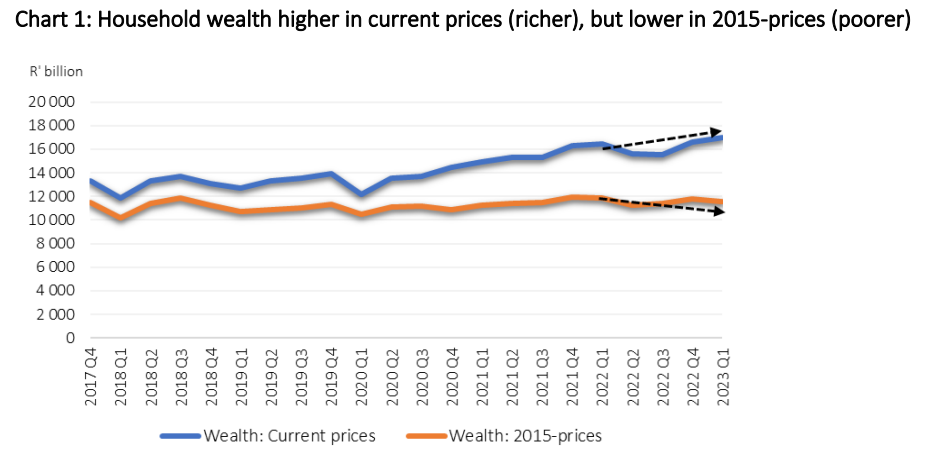
Measured in current prices, Momentum-Unisa estimated South African household wealth
(the difference between the value of household assets and their outstanding debt) increased
by R393.2 billion in the first quarter of 2023 (Q1 2023) to R16.9 trillion.
However, due to long-standing and high inflation, the real value of households’ net wealth has declined, meaning South Africans are poorer than they were a year ago when adjusting for CPI.
The researchers also noted a concerning trend from the deposit statistics published by the South African Reserve Bank is the deteriorating state of small unincorporated businesses (usually a person trying to make a living from a business).
Total deposits of unincorporated businesses, which may be used as a proxy for net income earned, decreased by R21 billion in current prices compared to a year ago in Q1 2023 – an indication of the strain caused by, among others, load-shedding and rising CPI and interest rates.
Household Net Wealth
Momentum-Unisa estimated the value of South African households’ wealth – expressed in current prices – at R16.9 trillion at the end of Q1 2023. This is R393.2 billion (2.4%) higher than at the end of Q4 2022 and R550.9 billion (3.4%) higher than in Q1 2022 (a year ago).
“This increase was caused by the value of household assets increasing more than household debt in the quarter. The value of household assets increased by an estimated R448.3 billion, and that of household debt by R55.1 billion,” said the researchers.
However, for households to really be richer, their wealth must increase by more than CPI. To establish whether household wealth increased by more or less than CPI since 2015, it must be expressed in 2015 (constant) prices to eliminate the effect of price increases on wealth.
The year-on-year CPI rate was 7.3% in Q1 2023, but household wealth increased by less – only 3.4% compared to Q1 2022.
Therefore, although household wealth was R550.9 billion higher compared to a year ago, when adjusted for inflation at 2015 prices, households are actually R336.1 billion poorer – meaning they could buy less with their wealth compared to Q1 2022.
Household Assets
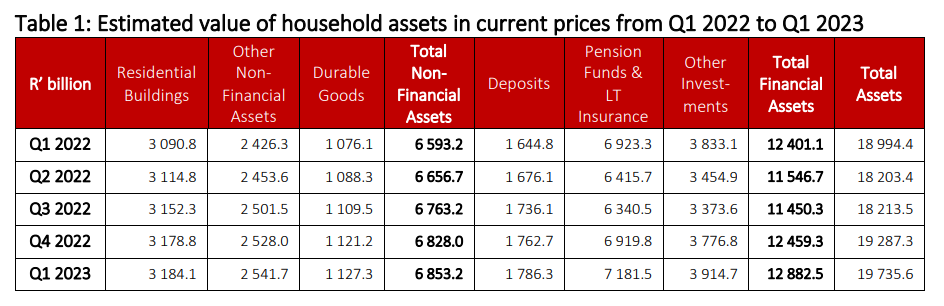
According to the index, the value of South African household assets increased by R448.3 billion in Q1 2023 to an estimated R19.7 trillion (in current prices) – R741.3 billion more than a year ago.
Household assets consist of two broad categories: non-financial assets (or tangible assets such as the value of residential property and durable goods) and financial assets (including the value of deposits/money in the bank, pension funds, long-term insurance, and investments).
The asset distributions were as follows in Q1 2023:
- Financial assets comprised 65.3% of total assets, and non-financial assets 34.7%.
- About 55.7% of financial assets were in pension funds and long-term insurance, 30.4% in investments and 13.9% in deposits. The share of deposits increased from 13.3% a year ago, while investments decreased from 30.9%.
- About 46.5% of non-financial asset holdings were in the form of residential property, 37.1% in other tangible assets and 16.4% in durable goods.
According to the report, in Q1 2023, pension funds and investments benefitted from, among others, rising share prices of companies – the JSE All Share Index (ALSI) increased from 73 048.6 points at the end of Q4 2022 to 76 100.2 points in Q1 2023.
Additionally, the deposit category benefited from rising interest rates, contributing to an increase in longer than six-month deposits, while one-day to six-month deposits decreased in Q1 2023.
However, the researchers noted that the value of financial assets – especially pension funds and investments – will be affected by the volatility of financial markets, which in turn is affected by daily changes in political and economic events and policy decisions such as rising domestic and international CPI and interest rates, as well as load-shedding.
Again, factoring in CPI, although the value of household assets increased in current prices, it decreased when expressed in 2015 prices. It was R229.2 billion lower in Q1 2023 and R333.6 billion less compared to Q1 2022.
Household Liabilities
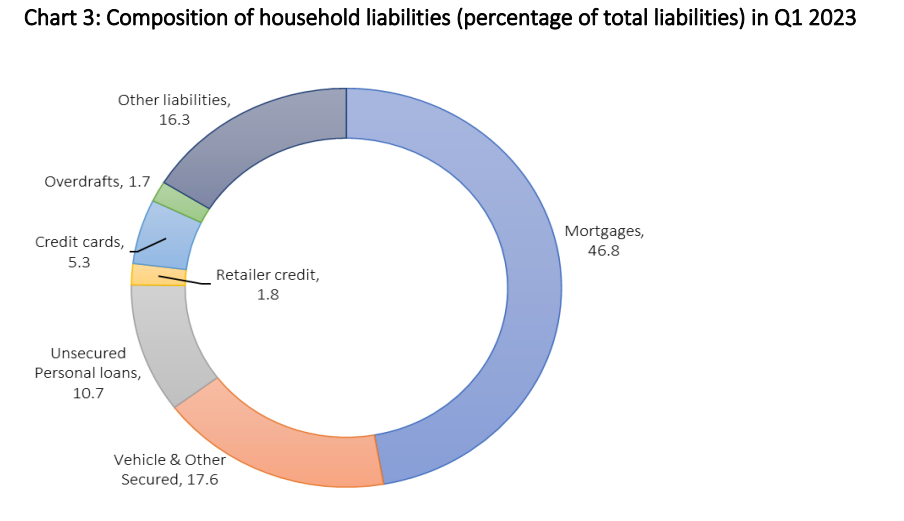
Regarding household liabilities, the data showed that the value of households’ outstanding liabilities (mostly credit) measured in current prices increased by an estimated R55.1 billion in Q1 2023 to R2.7 trillion.
“The increase in liabilities in Q1 2023 was dominated by the other debt category, which increased by R41 billion compared to mortgages,” the report said.
An estimated R30.8 billion of the R41 billion (or 75.1% of the other debt category) accrued from unsecured loans, credit facilities and other liabilities such as municipal and other accounts in arrears, developmental credit, micro loans, etc., while R10.2 billion emanated from instalment credit, which is dominated by vehicle purchases, the reported added.
“The increase in the unsecured credit and other liabilities components reflects the financial pressure households are grappling with,” the researchers said.
The increase in outstanding household liabilities compared to a year ago was R190.4 billion. The other debt category was R111 billion higher, and outstanding mortgages were R79.3 billion more.
The increase in other debt was also dominated by higher outstanding unsecured loans, credit facilities and other liabilities (73.6% of the increase in the other debt category).
Looking towards the rest of 2023, the index noted that, given the economic challenges, preliminary data indicates household wealth may stagnate in current prices and decline further when adjusted for inflation.