The truth about gambling in South Africa

According to the South African Reserve Bank (SARB), reports that South Africans spend R1.5 trillion on gambling are misleading.
In its March 2026 Quarterly Bulletin, the central bank addressed reports that South Africa spent R1.5 trillion on gambling in 2024, equivalent to over 20% of gross domestic product for that year.
The SARB said that while South Africans are definitely spending more on gambling, the R1.5 trillion figure doesn’t tell the full story.
Notably, the figure represents gambling turnover, but does not account for payouts and winnings.
Gambling turnover refers to the total amount that is wagered, encompassing both the initial bets and any winnings that are subsequently wagered again.
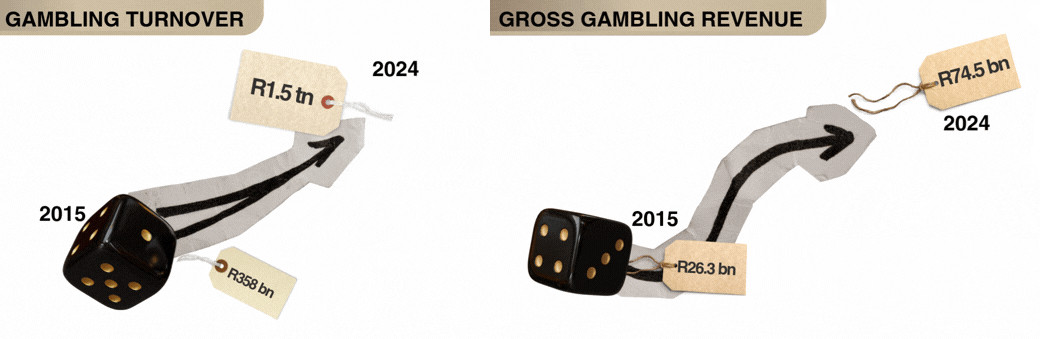
This turnover increased more than fourfold over a decade, from R358 billion in 2015 to approximately R1.5 trillion in 2024.
However, to get a clearer picture of how much households truly spend on betting, the SARB said it’s more effective to consider gross gambling revenue (GGR).
GGR is calculated by subtracting the winnings returned to players from the total amount wagered.
While GGR also experienced significant growth—rising from R26.3 billion in 2015 to R74.5 billion by 2024—this figure falls significantly short of the R1.5 trillion in reported turnover.
Post-COVID-19, growth in gambling accelerated as more individuals engaged in online betting, yet the activity still accounts for a minor share of overall household expenditure.
In inflation statistics, gambling is categorised under “games of chance” for household expenditure and inflation.
In 2024, games of chance accounted for 1.3% of total household spending, up from 1.1% in 2015. The share of GGR in relation to total household spending also rose from 0.9% to 1.6%.
However, it’s important to note that household spending on essential goods and services has also increased over this period.
While spending on gambling, particularly online betting, has risen significantly in recent years, its overall impact on total household spending remains relatively small compared to essential goods and services.
How much households spent in 2025
Growth in real final consumption expenditure by households accelerated to 1.2% in the fourth quarter of 2025, driven by an increase in real disposable income and a boost in consumer confidence.
Spending on semi-durable goods and services rose more rapidly during this period, while spending on durable and non-durable goods slowed.
Accompanying the rise in consumer spending, household debt rose further in the fourth quarter of 2025, with growth across most categories of household credit.
As a result, household debt as a percentage of nominal disposable income increased from 61.5% in the third quarter to 61.8% in the fourth quarter.
At the same time, the cost of servicing debt as a proportion of disposable income marginally decreased from 8.5% to 8.4%.
Households’ net wealth continued to rise in the fourth quarter of 2025, with the increase in the market value of total assets outpacing that of total liabilities, largely due to a significant boost in share prices.
The domestic share market had an outstanding year in 2025, with the FTSE/JSE All-Share Index (Alsi) achieving its best performance since 2005, soaring by 37.7%.
Real gross fixed capital formation grew at a slightly slower rate in the fourth quarter of 2025, primarily propelled by increased fixed capital expenditures by public corporations and private enterprises, while investment by the general government declined.
In terms of asset categories, real fixed investment in machinery and equipment, construction works, and other asset types increased in the fourth quarter, while investment in other categories decreased.
Year-on-year, real investment spending contracted further by 2.2% in 2025, with the ratio of nominal gross fixed capital formation to nominal GDP decreasing to 13.9%.
Total household-surveyed employment grew moderately, adding 44,000 jobs in the fourth quarter of 2025.
Most job gains were in the formal sector, with a smaller increase in the household sector, while informal-sector employment declined sharply.
Year-on-year, the growth rate of total employment slowed down from 0.6% in the third quarter to 0.1% in the fourth quarter.