This South African company is now one of the biggest in the world – almost as big as Nike

The market capitalisation of the 100 largest companies globally has increased significantly by over $2.6 trillion or 15% compared to 31 March 2017, according to PwC’s Global Top 100 ranking.
This rise comes on top of a 12% increase in 2017, and the total capitalisation continues to grow, year on year, since the global financial crisis.
Forty eight percent of growth in the past year has been contributed by US companies, on the back of strong economic conditions and their pre-eminent position in the technology sector. Europe registers an increase in market capitalisation for the second year running, with its market share remaining unchanged.
For the fourth year running, the US accounts for more than half of the Top 100 (54 companies, down from 55 in 2017). It also weighs in with 61% of the overall market capitalisation, down from 63% last year.
China, the second largest contributor to the Top 100, saw an increase of 57% when compared to 2017, totalling $2,822 billion.
85 companies from 2017 survived to be in the list at 31 March 2018 – a decrease of 7% compared to last year (91 companies from the 2016 Top 100 list were on the 2017 list).
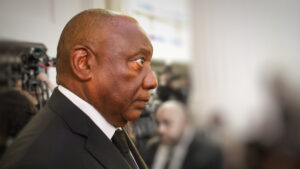
The rest of the world saw two companies drop out of the Top 100 in the last year and a drop o f $15 billion in market cap. Japan saw the biggest loss out o f all o f the locations and South Africa joined the Top 100 with its first company – Naspers.
Amazon is the strongest performer in terms of absolute increase in market capitalisation, gaining $278 billion or 66% in value compared to 2017. It’s followed by two Chinese companies: Tencent, up by $224 billion 0r 82%, and Alibaba, rising by $201 billion or 75%. The next three highest performers in absolute terms are all from the US – Microsoft, Alphabet and Apple.

Despite coming sixth in terms of absolute growth in value, Apple retains pole position in terms of market capitalisation for the seventh year in a row. However, its lead over Alphabet in second place has narrowed by 25%, to $132 billion from $175 billion last year.
Apple has also returned more cash to shareholders than any other company, handing back another $31 billion to investors in dividends and share repurchases in calendar year 2017 (having distributed $29 billion in calendar 2016).
JP Morgan Chase ranks second in term of value distribution with $24 billion, up from $18 billion the previous year.
Turning to sectors, technology remains ahead of the financial sector in market capitalisation for the third successive year, with consumer goods in third place. The global top three are still technology companies – Apple, Alphabet, Microsoft – followed by Tencent in fifth position and Facebook in eighth, down from sixth last year.
European companies were especially hard hit a decade ago by the global financial crisis, and have seen fluctuations in their market capitalisations since then.
However, the past year has seen Europe sustain its recent recovery, with the number of European companies in the Top 100 rising from 22 to 23, and an increase of $331 billion in their aggregate market capitalisation.
Despite this improvement, Europe is still significantly below the 33 companies it had in the Top 100 in 2010. And its 17% market share in 2018 – while unchanged from 2017 – is down from 27% in 2009.
The market capitalisation of the companies from China in the Top 100 leaps by 57% compared to 2017, with 12 Chinese companies making the Top 100, up from 10 last year.
Hong Kong contributes another two companies, up from one in 2017. In terms of absolute increase in market capitalisation, Tencent is the leading Chinese performer in 2018 for the second year running, and the second highest overall after Amazon, increasing its value by 82% to $496bn.
Alibaba is the second highest performer from China and third overall, increasing its value by 75% to $470bn. These strong increases have pushed both companies into the Top 10 in terms of market capitalisation, with Tencent rising to fifth and Alibaba to seventh.
Naspers enters the list for the first time, at 79th, with a market cap of $107 billion as at the end of March 2018. This is up from a mere $7 billion in 2009, with company now as ‘big’ as apparel giant, Nike.
JSE-listed Naspers now derives as much as 84% of revenues from outside South Africa, up from 80% a year ago, and has a strong M&A strategy.
Top 100 global companies 1-20
 Top 100 global companies 61-80

Global Top 100 companies per location – absolute market capitalisation change