Eskom selling less electricity, but raking in billions in profit from customers

National power utility Eskom has presented an update for the third quarter of its financial year, pointing to a second consecutive year of profits, despite selling less electricity.
According to the group, its year-to-date revenue (March to December 2025) hit R273.7 billion, up 3.4% year-on-year.
Its full-year forecast is for revenue to hit R355 billion, a 4.1% improvement on 2025.
EBITDA is expected to hit R95 billion (2025: R99 billion), while profit before tax is anticipated slightly higher than 2025 at R26 billion (2025: R24 billion).
Profit after tax is expected to be R2 billion higher than the R16 billion recorded in 2025.
While the financials show a significant turnaround for the group—which made a massive R55 billion loss in 2024—the figures belie a worrying reality.
Eskom noted that its revenue growth is mainly being driven by tariff increases, where South African consumers and Eskom’s customers have been hit by massive price hikes over the years.
At the same time, electricity sales have dropped, with the group recording year-on-year declines of 5.7% in local sales and 5.6% in international sales.
This reflects a local decline of 7.6 TeraWatt hours sold, it said.
This context is crucial given that Eskom relies on revenue to sustain its existing operations and continued growth, including the costs of production, staff, capex, debt services and repairs and maintenance.
Repairs and maintenance of the group’s ageing grid also exceeded the budget for the period by 7%, bringing the total to R23.5 billion. It expects the budget to be exceeded by 13.3% by the end of the full year.
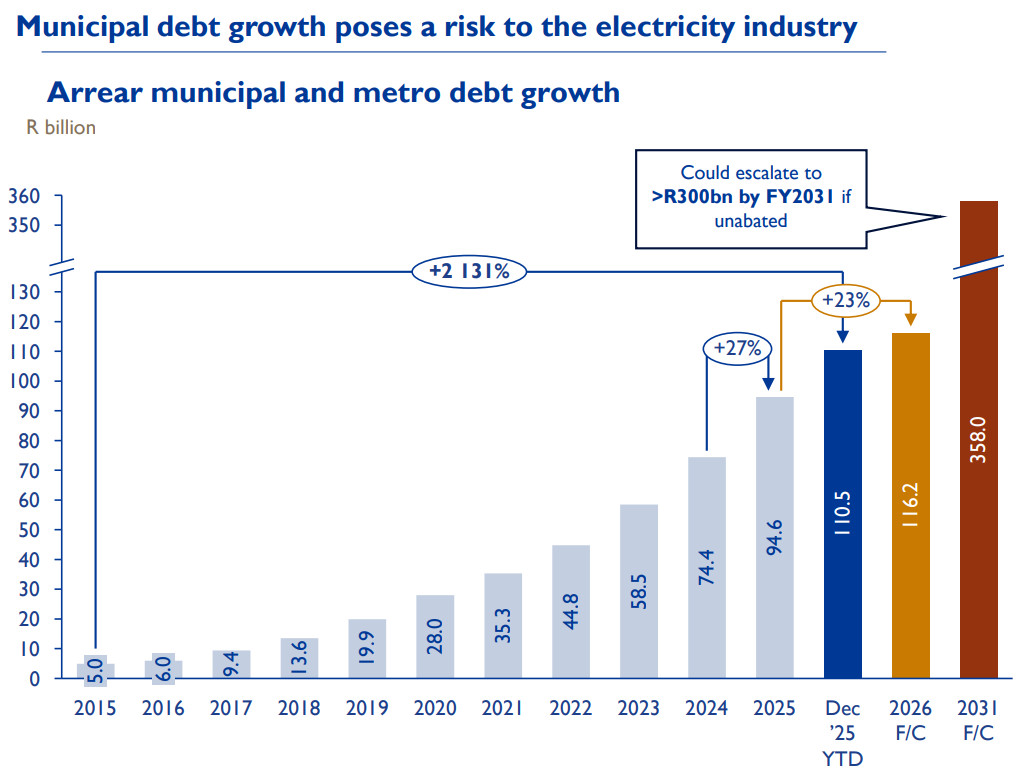
Making its revenue issues worse is the accumulation of municipal debt, which is now at a staggering R110 billion and is expected to reach R116 billion by the end of the financial year, it said.
If not addressed, this could hit over R358 billion by 2031.
Illustrating the crisis the group is facing, it has allocated R343 billion to improve operations as part of its corporate plan. This needs to be funded from somewhere.
R104 billion is being directed to mandatory projects, such as overhauls, emissions projects and grid development. R82 billion is being directed to maintenance and refurbishment projects.
R130 billion is for growth and expansion projects, and R27 billion is going toward a massive prepaid meter rollout and upgrades at Koeberg.
However, with declining sales and revenue being driven by tariffs, this should sound alarm bells for Eskom customers.
The reality is that the utility requires a much higher return on assets than it currently achieves to be sustainable.
Eskom indicated that its current return on assets is only around 8%, whereas a return closer to 16% is actually required to achieve full cost reflectivity and long-term sustainability.
Eskom noted that it is pursuing “cost-reflective” tariffs, which has seen the group implement massive tariff hikes over the years.
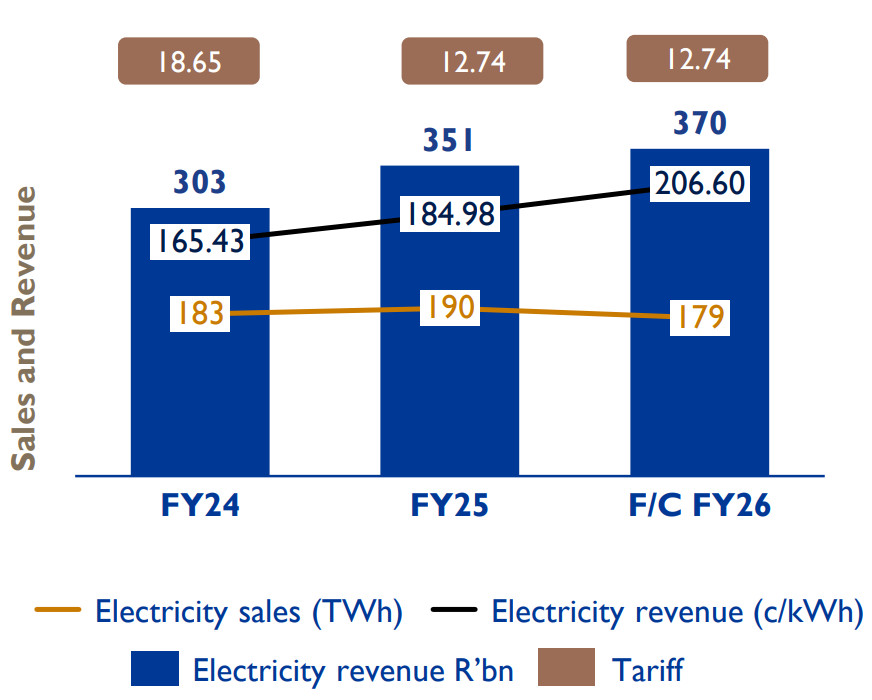
But as the cost per kilowatt-hour has increased, sales have declined, moving from 183TWh sold in FY24 at 165.4 c/kWh, down to 179TWh (forecast) sold in FY26 at 206.6 c/kWh.
Eskom Sales vs Revenue FY26 (forecast)
In its MYPD6 application, Eskom’s tariff hikes were “contained” to lower increases of around 5.4% and 6.2% for FY27 and FY28, respectively.
However, blunders by energy regulator Nersa resulted in these increases jumping to 8.8% for each year, with more to come in the next application.
Eskom assumes that future allowed tariffs will not exceed “double digits”, but anything above inflation (targeted at 3%) will still put customers and households under severe pressure.
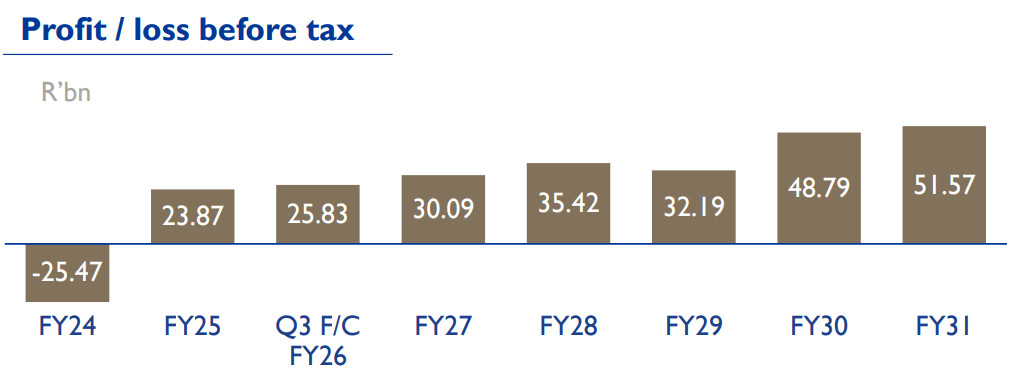
Regardless, the utility is forecasting its profits to keep rising, projecting a steady climb to R52 billion in pre-tax profit by FY31.
It noted that the tariff path, sales volumes, and municipal non-payment/arrears remain risks to this outlook.
Eskom FY26 Forecast
| Feature | FY24 | FY25 | FY26 (forecast) | FY25/26 change (forecast) |
|---|---|---|---|---|
| Revenue | R296 billion | R341 billion | R355 billion | +4.1% |
| EBITDA | R43 billion | R99 billion | R95 billion | -4.0% |
| Profit/(Loss) before tax | (R25 billion) | R24 billion | R26 billion | +8.3% |
| Profit/(Loss) from Continued Operations | (R55 billion) | R16 billion | R18 billion | +12.5% |