André de Ruyter’s Eskom nightmare is coming true
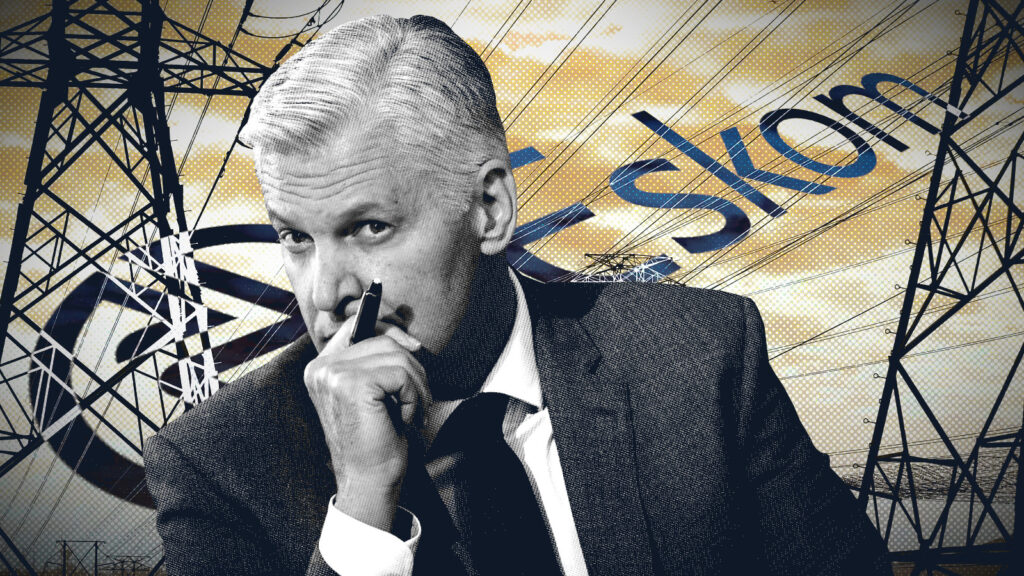
Former Eskom CEO André de Ruyter’s warnings about Eskom’s financial collapse and the threat of grid defection are slowly becoming a reality in South Africa.
De Ruyter warned in 2023 that the power utility was heading towards a financial “death spiral”, driven by rising costs, declining electricity sales, and the loss of its best-paying customers.
In his book Truth to Power: My Three Years Inside Eskom, published shortly after he left the utility, de Ruyter described Eskom’s future as a “well-lit” path towards financial collapse if key structural problems were not addressed.
The main concern was that Eskom was caught in a dangerous cycle. The utility needed to raise tariffs to cover rising costs and debt obligations.
However, higher prices encouraged customers to reduce consumption or generate their own electricity, resulting in lower sales volumes.
“Not only were tariffs per unit of electricity not keeping pace with input cost inflation, but electricity consumption had been dropping by about 1% per annum, due to South Africa’s rapidly shrinking manufacturing and mining sectors,” de Ruyter wrote.
His most serious warning focused on what he called “grid defection”, which was the gradual departure of large municipalities, businesses and households from Eskom’s electricity network through self-generation and purchases from independent power producers.
“If the current trend of grid defection—with large municipalities and industrial customers buying from independent power producers wheeling across the transmission grid—continues, it is not inconceivable that Eskom will be left with non-paying areas,” he said.
“These non-paying areas include Soweto and delinquent municipalities such as Maluti-a-Phofung and Lekwa. In no time, we would be back to begging for bailouts.”
While de Ruyter’s comments drew attention in 2023, Eskom had been warning about the same problem for years. BusinessTech found concerns about grid defection in Eskom’s annual reports dating back to 2016.
In Eskom’s 2016 annual report, Eskom noted that falling prices for alternative technologies were encouraging customers to leave the grid, “negatively impacting our revenue and business model”.
The utility said consumers were improving energy efficiency and increasingly making their own electricity-generation decisions.
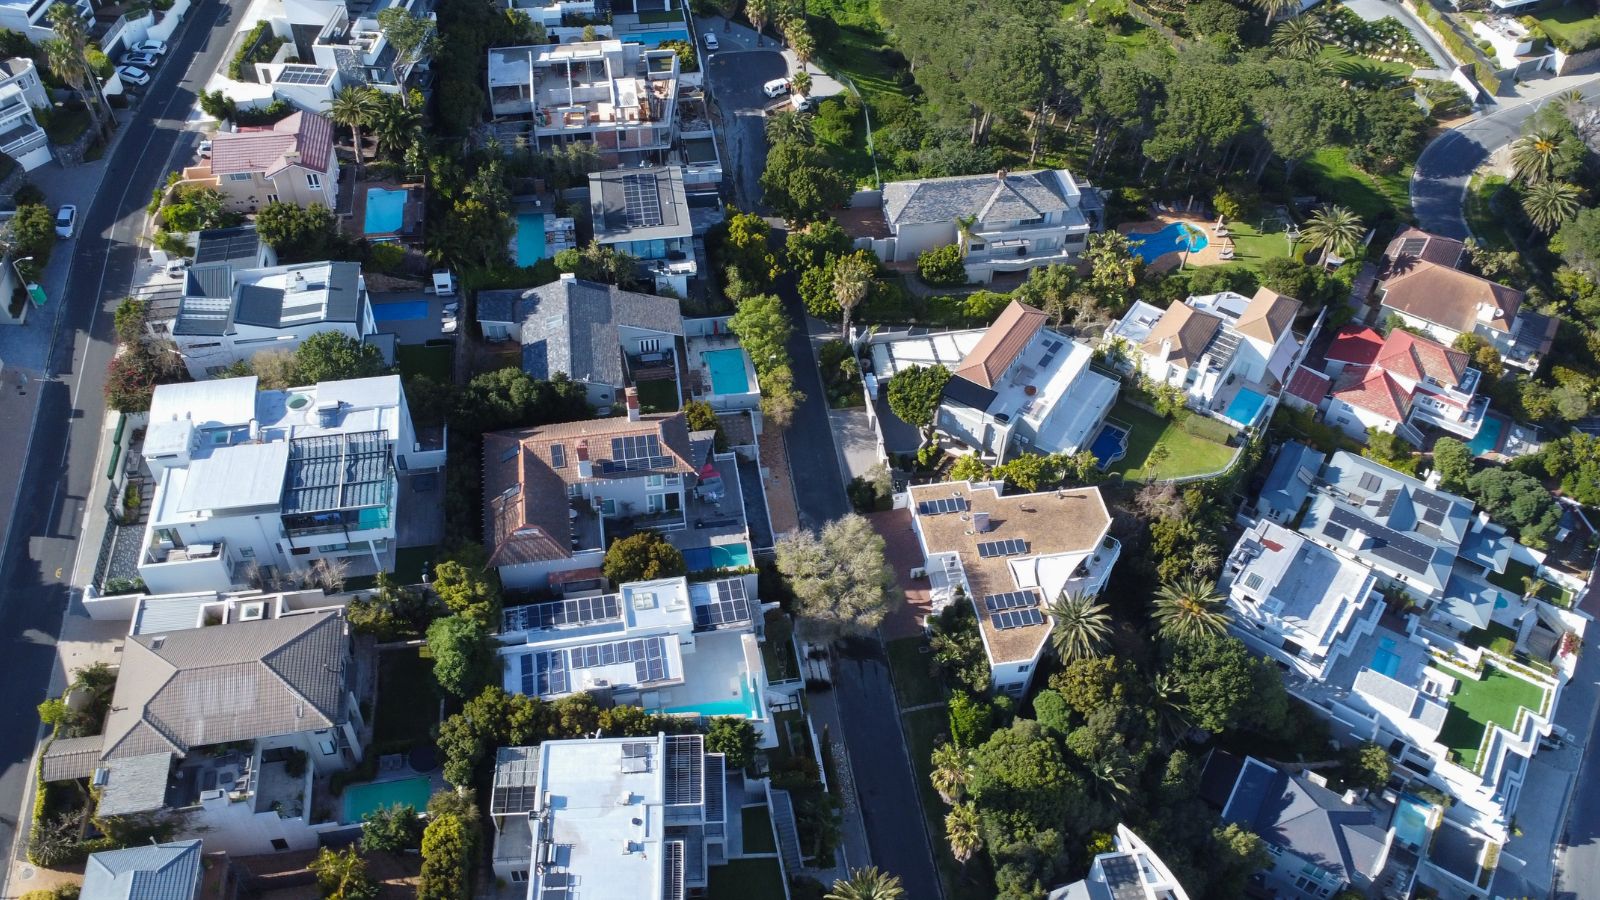
South Africa’s great grid defection
By 2020, Eskom reported that “shifts to self-generation technology have led to declining electricity sales volumes over many years”.
In 2022, it warned that customers with their own generation capacity could leave the grid while still relying on Eskom for backup services, for which Eskom was not paid, creating potential financial losses.
The concern became even more pronounced in subsequent years. Eskom’s 2024 reports attributed declining sales volumes to economic pressure, load shedding, rooftop solar installations and electricity theft.
In 2025, it identified customer defection and growing embedded self-generation as risks to its operational sustainability.
Eskom’s reports do not consistently publish the exact residential category breakdown for all metrics every single year.
Specifically, the residential breakdown for units sold (GWh) was omitted in the reports spanning 2012 to 2017, preventing an accurate effective price calculation for those years.
The specific household metric breakdowns for 2006, 2007, and 2025 were also omitted from the provided excerpts.
However, most of the data perfectly highlight the grid defection trends, and the numbers suggest the trend is accelerating.
Between 2008 and 2024, the effective price households paid increased by about 411%, rising from 44.12 cents per kilowatt-hour to 225.69 cents per kilowatt-hour.
At the same time, household electricity consumption fell by nearly 18%, dropping from 10,423 gigawatt-hours (GWh) to 8,559 GWh.
Despite selling significantly less electricity, Eskom’s revenue from households rose from R4.6 billion to R19.3 billion due to steep tariff increases.
Recent data shows the decline in demand is continuing. Between 1 January and 24 May 2026, Eskom recorded electricity demand of 69,492 GWh, compared with 77,030 GWh over the same period in 2025.
The utility has forecast energy sales of 179,000 GWh for the financial year ending March 2026. If achieved, it would mark the first time since 2000 that annual demand falls below 180,000 GWh.
South Africa’s growing adoption of solar power is playing a significant role in this shift. According to Statistics South Africa’s 2025 General Household Survey, the number of homes with solar panels increased from just over 200,000 in 2019 to nearly 700,000 in 2025.
This means the share of households generating their own electricity almost tripled, from 1.2% to 3.4%.
More broadly, households with some form of solar capability increased to around 1.4 million, representing 6.8% of all households, up from 4.6% in 2019.
De Ruyter was not the first Eskom leader to raise alarm over these trends. His predecessor, Phakamani Hadebe, used the term “death spiral” as early as July 2019, shortly before resigning.
“We are now facing the death spiral, and this is because of a number of our clients moving off the grid,” Hadebe said.
Economist Dawie Roodt believes the cycle is unlikely to be reversed. According to Roodt, Eskom’s debt burden and operational inefficiencies leave it with little choice but to continue raising tariffs.
“Eskom needs the money to run an inefficient institution and to repay its debt,” Roodt said. “There is no way Eskom will accept or survive lower tariffs.”
Below is a table comparing the sharp increases in Eskom’s electricity prices and revenue generation, despite a reduction in units sold due to grid defection, as shown in its 2018/19 to 2024/25 annual reports.
The “Effective Price (c/kWh)” is calculated by taking the total residential revenue generated and dividing it by the residential units sold (GWh)
| Year | Household Revenue Generated (R million) | Household Units Sold (GWh) | Effective Price (c/kWh) | Price % Increase (year-on-year) |
|---|---|---|---|---|
| 2018/19 | 14,585 | 12,302 | 118.56 | N/A |
| 2019/20 | 14,771 | 11,748 | 125.73 | 6.0% |
| 2020/21 | 16,069 | 11,293 | 142.29 | 13.2% |
| 2021/22 | 16,924 | 10,949 | 154.57 | 8.6% |
| 2022/23 | 18,680 | 10,520 | 177.57 | 14.9% |
| 2023/24 | 18,052 | 9,177 | 196.71 | 10.8% |
| 2024/25 | 19,317 | 8,559 | 225.69 | 14.7% |