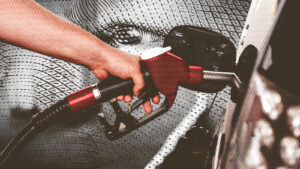
How much South Africans spend on petrol vs the UK, Switzerland, USA, and others

Although South African petrol prices are lower than in other countries, South Africans spend a larger proportion of their income on petrol compared to most other nations.
According to globalpetrolprices.com, South Africans currently pay R22.98 per litre of petrol – this number is calculated by averaging the inland price (R23.34) and coastal price (R22.62) for a litre of 95 unleaded in South Africa.
This puts South African petrol prices at 95 out of the 168 countries covered by globalpetrolprices.com, which is cheaper than nine additional countries compared to last year when we ranked 86th.
All the provided figures are correct as of 01 May 2023.
The top fifteen countries with the highest fuel prices are listed in the table below (all prices were provided in Rands).
| Rank | Country | Petrol price per litre in ZAR |
|---|---|---|
| 1 | Hong Kong | 54.68 |
| 2 | Iceland | 42.58 |
| 3 | Monaco | 42.18 |
| 4 | Central African Republic | 40.16 |
| 5 | Finland | 40.02 |
| 6 | Denmark | 39.69 |
| 7 | Norway | 39.14 |
| 8 | Greece | 38.20 |
| 9 | France | 38.16 |
| 10 | Barbados | 37.76 |
| 11 | Switzerland | 37.48 |
| 12 | Italy | 37.41 |
| 13 | Netherlands | 37.24 |
| 14 | Mayotte | 37.18 |
| 15 | Germany | 36.43 |
| 27 | United Kingdom (UK) | 33.58 |
| 95 | South Africa | 22.98 |
Notably, many countries that pay a significant amount for petrol – especially those in Europe – depend on Russian oil. Russia’s invasion of Ukraine has devasted global energy supply chains, resulting in much higher fuel prices. However, this has somewhat dampened in contrast to 2022.
Africa has not been immune to this, either, with South Africa through to the Central African Republic, a net gasoline importer, paying more for petrol.
Switzerland, Norway, and Luxembourg, on the other hand, are nations that are incredibly oil-rich but charge a significant amount for petrol. This is because the fuel in the Nordic country is highly taxed.
Moreover, these nations are highly invested in electric cars – four of five new vehicles are electric – and high fuel prices incentivise consumers away from petrol-fuelled vehicles.
Meanwhile, Hong Kong and Monaco are both city-states that rely on refined fuel imports and thus pay a lot more for petrol.
Proportional spend
Although many countries spend more per litre of petrol, not all of them pay a greater proportion of their yearly earnings on fuel than South Africans.
Below is a table of the average annual earnings in OECD countries after tax (2022), converted to rands, and split across 365 days for the daily average:
| Country | Annual earnings local currency | Annual earnings in ZAR | Daily-earnings in ZAR |
|---|---|---|---|
| Switzerland | 82 202 Swiss Francs | 1 753 210 | 4 803 |
| Iceland | 7 869 300 Ice Kronas | 1 083 551 | 2 969 |
| Luxembourg | 47 639 Euros | 989 952 | 2 712 |
| USA | 48 793 Dollars | 932 390 | 2 554 |
| Australia | 72 910 Aus Dollars | 931 321 | 2 551 |
| Norway | 483 940 Nor Krones | 866 697 | 2 374 |
| Netherlands | 41 556 Euros | 863 545 | 2 365 |
| Canada | 60 784 Can Dollars | 859 527 | 2 354 |
| Denmark | 301 933 Dan Krones | 842 755 | 2 308 |
| Ireland | 39 616 Euros | 823 260 | 2 255 |
| UK | 33 827 Pounds | 808 610 | 2 215 |
| Austria | 35 837 Euros | 744 703 | 2 040 |
| Israel | 139 601 Isr Shekels | 728 584 | 1 996 |
| Finland | 34 971 Euros | 726 707 | 1 991 |
| Germany | 34 438 Euros | 715 631 | 1 960 |
| Sweden | 374 517 Swe Krona | 689 467 | 1 889 |
| Belgium | 33 006 Euros | 685 874 | 1 879 |
| New Zealand | 56 374 NZ Dollars | 667 865 | 1 829 |
| France | 30 052 Euros | 624 489 | 1 710 |
| South Korea | 41 888 689 Won | 598 046 | 1 638 |
| Japan | 4 004 449 Yen | 561 018 | 1 537 |
| Italy | 24 102 Euros | 500 846 | 1 372 |
| Spain | 22 294 Euros | 463 276 | 1 269 |
| Estonia | 16 319 Euros | 339 113 | 929 |
| Czech Republic | 380 699 Cze Koruna | 334 490 | 916 |
| Portugal | 15 526 Euros | 322 635 | 883 |
| Slovenia | 15 495 Euros | 321 990 | 882 |
| Greece | 15 335 Euros | 318 666 | 873 |
| Chile | 10 688 392 Chi Pesos | 259 965 | 712 |
| Poland | 56 349 Zloty | 259 501 | 711 |
| Slovak Republic | 11 769 Euros | 244 563 | 670 |
| Hungary | 4 208 193 Forint | 236 286 | 647 |
| Mexico | 137 204 Mex Peso | 148 939 | 408 |
| Turkey | 101 304 Tur Lira | 98 412 | 270 |
South Africa is not an OECD nation, so we have taken the most recent data from the BankservAfrica Take-home Pay Index, which puts the average South African’s pay after tax at R15,321 a month or R504 a day.
This data should also present South Africa in a better light as the other countries mentioned in the table only have income stats from the end of last year, which will be lower than this year as it has not been adjusted for inflation.
When expressed as a percentage of daily income, it’s clear that South Africa, despite having a relatively lower local fuel price, spends far more on petrol than most other OECD nations at 4.56% of daily income – putting the country in the top five most expensive countries.
Turkey, Mexico, Hungary, and the Slovak Republic are the only countries that spend a larger proportion of their salaries on fuel than South Africans, with Turkey the highest at 7.16%.
On the opposite side of the spectrum, the USA has the lowest proportional spend, at just 0.74%.
| Country | Daily-earnings in ZAR | Petrol price per litre in ZAR | % of income |
|---|---|---|---|
| Turkey | 270 | 19.34 | 7.16% |
| Mexico | 408 | 24.82 | 6.08% |
| Hungary | 647 | 31.39 | 4.85% |
| Slovak Republic | 670 | 31.55 | 4.70% |
| South Africa | 504 | 22.98 | 4.56% |
| Greece | 873 | 38.20 | 4.36% |
| Chile | 712 | 29.85 | 4.19% |
| Poland | 711 | 29.57 | 4.16% |
| Portugal | 883 | 33.70 | 3.82% |
| Estonia | 929 | 34.52 | 3.72% |
| Czech Republic | 916 | 32.23 | 3.52% |
| Slovenia | 882 | 28.73 | 3.26% |
| Italy | 1 372 | 37.41 | 2.73% |
| Spain | 1 269 | 32.63 | 2.64% |
| France | 1 710 | 38.16 | 2.23% |
| Finland | 1 991 | 40.02 | 2.06% |
| Sweden | 1 889 | 35.38 | 1.87% |
| Germany | 1 960 | 36.43 | 1.85% |
| Belgium | 1 879 | 34.52 | 1.84% |
| Israel | 1 996 | 35.56 | 1.78% |
| Denmark | 2 308 | 39.70 | 1.72% |
| Norway | 2 374 | 39.14 | 1.64% |
| New Zealand | 1 829 | 29.85 | 1.63% |
| Austria | 2 040 | 32.57 | 1.59% |
| Netherlands | 2 365 | 37.24 | 1.57% |
| UK | 2 215 | 33.58 | 1.52% |
| Japan | 1 537 | 22.73 | 1.48% |
| Ireland | 2 255 | 33.05 | 1.47% |
| Iceland | 2 969 | 42.58 | 1.43% |
| South Korea | 1 638 | 23.07 | 1.41% |
| Luxembourg | 2 712 | 31.59 | 1.16% |
| Canada | 2 354 | 24.22 | 1.05% |
| Australia | 2 551 | 20.92 | 0.82% |
| Switzerland | 4 803 | 37.49 | 0.78% |
| USA | 2 554 | 18.95 | 0.74% |
All conversions were done at the respective currency/ZAR exchange rates on 15 May 2023.