South Africa’s public sector productivity versus Canada, Singapore, and Rwanda

South Africa’s public service faces considerable challenges when measured against international benchmarks, particularly in comparison to high-performing countries like Canada, Singapore, and Rwanda.
This is according to a recent report titled “Productivity as a Frontier in the South African Public Service,” which was commissioned by the Presidency and led by a team of academics.
The report seeks to ascertain South Africa’s public service productivity compared to global peers.
It concludes that while the country’s productivity legislation and policies fare well comparatively, the challenge lies in their implementation and enforcement.
The report reveals wide gaps in key areas such as innovation, leadership, the use of ICT, and citizen satisfaction.
Factors such as corruption, lack of quality education, and poor skills development are critical issues to address to achieve desired productivity levels and fulfil the government’s social contract with its citizens.
Additionally, there is a lack of interconnectedness across departments, which bears ripple effects on overall productivity.
To improve public sector productivity, the report noted that South Africa must invest in skills development, foster innovation, and modernise recruitment and performance systems.
Embracing ICT, promoting ethical leadership, increasing flexibility, and intensifying anti-corruption efforts are also essential.
Above all, consistent transparency and accountability must be prioritised at every level, noted the report.
“This report provides both awakening and inspiring insights,” said Public Service and Administration Minister Inkosi Mzamo Buthelezi.
“The Department of Public Service and Administration will incorporate the findings of this report into the ongoing development of the Public Service Productivity Framework.”
“This report is not just a diagnostic tool. It is a call to action, as improving productivity in the public service is not a choice; it is a necessity for building trust, delivering quality services, and achieving sustainable development”, he added.

South Africa vs Canada
“Canada and South Africa are two very different countries with different political, economic, and social systems. However, it is possible to compare their public service productivity based on available data,” noted the report.
The report noted that Canada’s public service achieves high productivity through strong employee development, effective use of technology, a positive work environment, robust performance management, and transparent, adaptable decision-making.
Public Service Productivity: Canada’s public service productivity rose by 7.2% between 2007 and 2018, driven by technology and automation.
In contrast, South Africa’s productivity declined from 2000 to 2014 due to poor management, limited training, and weak accountability.
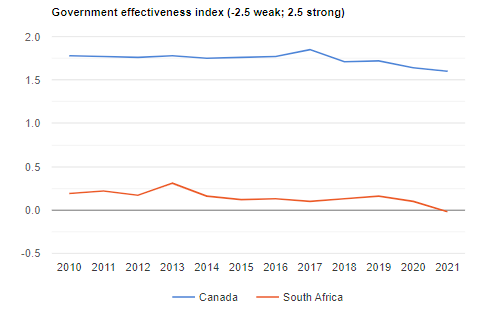
Government Effectiveness: From 2010 to 2021, Canada scored between 1.5 and 2.0 out of 2.5, reflecting consistent effectiveness. South Africa trailed at 0.5, with a declining trend.
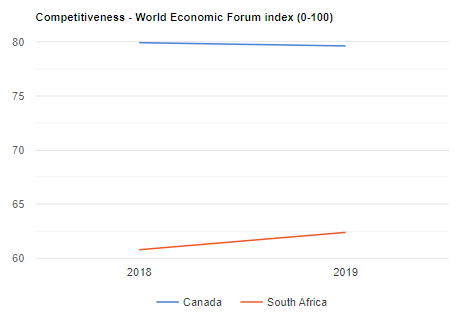
Competitiveness: In the 2019 Global Competitiveness Report, Canada ranked 14th overall and 5th in public sector performance; South Africa ranked 60th and 105th, respectively.
Canada’s average score was 80/100; South Africa’s was 60.
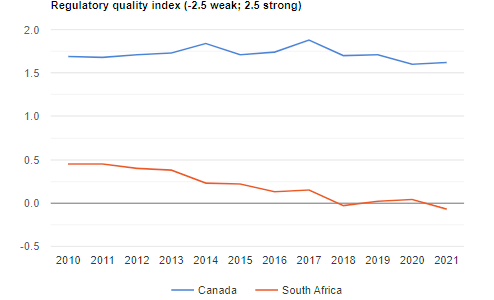
Regulatory Quality: Canada scored 1.5–2.0, thanks to transparent, consistent regulations. South Africa scored just 0.5, hindered by a fragmented and complex regulatory environment.
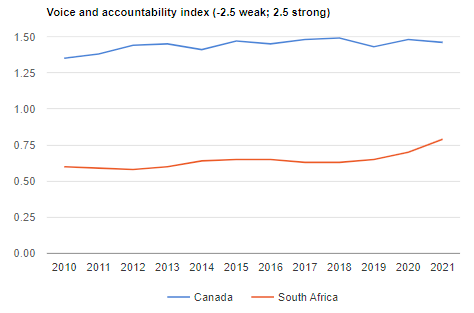
Voice and Accountability: Canada maintained a 1.5 average score and ranked 6th globally in 2021 due to strong democratic institutions, press freedom, and citizen engagement.
South Africa, despite its democratic framework, consistently scored 0.5, with challenges linked to corruption, inequality, and political instability undermining accountability.
South Africa vs Singapore
“While the comparison of countries in different continents may be questioned, for purpose of benchmarking, this comparison is crucial for purposes of lifting best practices which may help South Africa,” noted the report.
Since gaining independence in 1965, Singapore has become one of the world’s most prosperous nations, with the third-highest GDP per capita. In 2022, productivity rose from 101.7 to 114.1 points, reflecting steady growth.
Singapore’s civil service is internationally acclaimed for its efficiency and low corruption levels.
Transparency International ranks it among the least corrupt globally, supported by the Corrupt Practices Investigation Bureau.
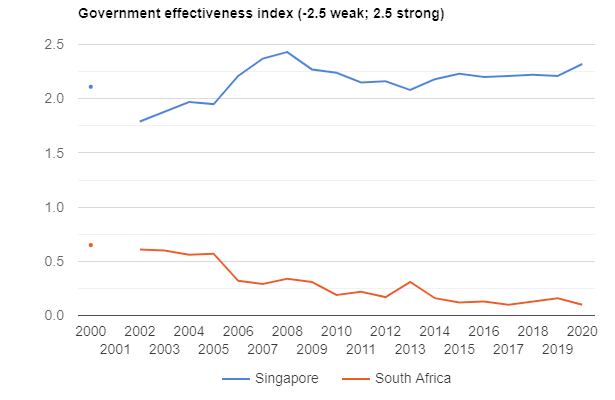
Government Effectiveness: Since 2006, South Africa has been on a downward slope regarding government effectiveness, rated at 0.5 out of 2.5.
During the same period, Singapore scored above 2.0, peaking at almost 2.4, demonstrating sustained measures to recruit talent and use its Public Service Commission effectively.
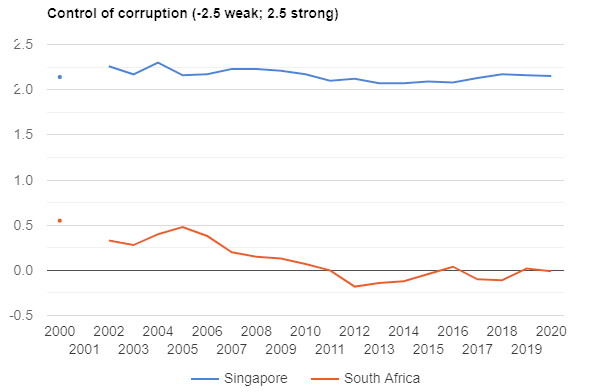
Control of Corruption: Between 2005 and 2012, perceptions of South Africa’s ability to control corruption declined, with minimal improvement after 2012.
Singapore, in contrast, shows “sterling performance” due to its “zero tolerance to corruption.”
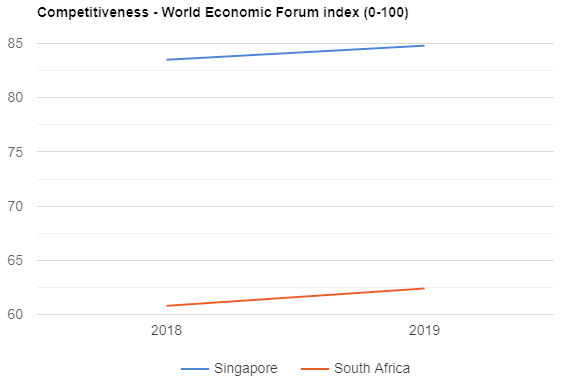
Competitiveness: South Africa’s competitiveness averaged above 60 out of 100, with a slight improvement between 2018 and 2019.
Singapore, during the same period, consistently scored below 85, indicating a stronger competitive edge.
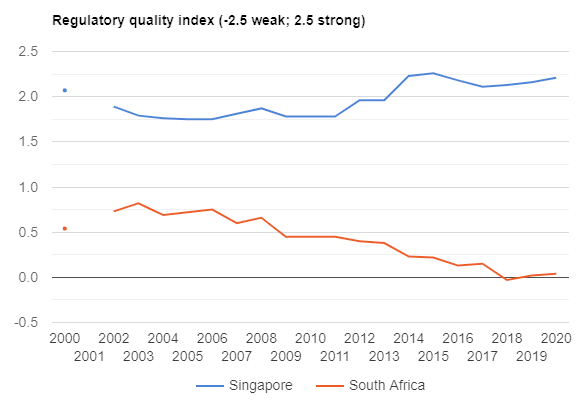
Regulatory Quality: Between 2012 and 2020, South Africa’s regulatory quality declined until showing signs of stability between 2018 and 2020.
Singapore, on the other hand, saw improvement and plateaued above 2.0.
Voice and Accountability: South Africa experienced a sharp decline in voice and accountability between 2005 and 2006, moving into “negative territory,” with further decline from 2013 to 2020.
Singapore has again improved from below the 2.0 score to just above 2.0.
“Good governance cannot prevail where public and administrative accountability as well as transparency are weak,” noted the report.
The report emphasises that accountability, the rule of law, and transparency need to be strengthened in South Africa.
“The comparison of South Africa and Singapore … shows that the two countries are not on the same level. Singapore is far ahead of South Africa on several indicators which suggest high productivity and good governance,” noted the authors.
South Africa vs Rwanda
The following section focuses on Rwanda, a country that is on the same continent and “may be said to have almost the same conditions as South Africa,” noted the report.
Despite its violent past, including the 1994 genocide that killed over half-a-million people, Rwanda has achieved notable political stability, economic growth, and poverty reduction.
In recent years, the country has been praised for its development progress and strong, though often authoritarian, governance.
As noted in the report, Rwanda is considered a global leader in anti-corruption efforts. Transparency International ranked it 44th out of 168 countries in 2015, a sharp rise from 83rd in 2005.
The government has prioritised efficient public service and business-friendly reforms, starting a business costs around $20 and takes just three days, far outperforming the sub-Saharan average.
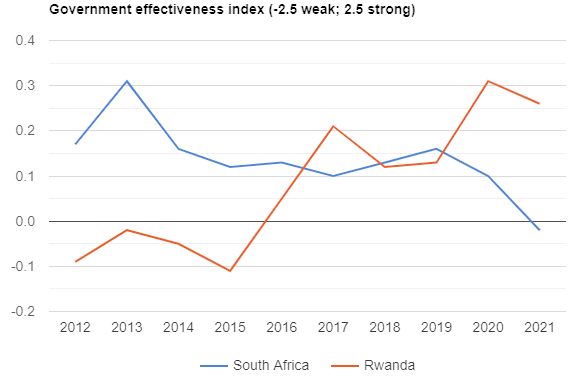
Government Effectiveness: From 2012 to 2021, Rwanda saw steady improvement, particularly between 2015–2016, largely due to its performance-based “Imihigo” system.
South Africa peaked in 2013 but declined thereafter, with notable drops in 2014 and 2019.
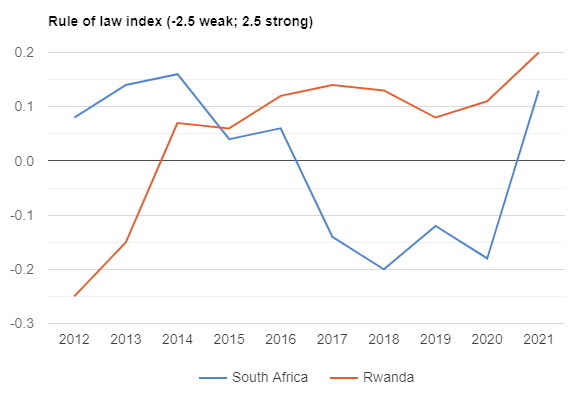
Rule of Law: Rwanda’s progress has been consistent over the decade, while South Africa declined between 2014–2018, with only partial recovery by 2020.
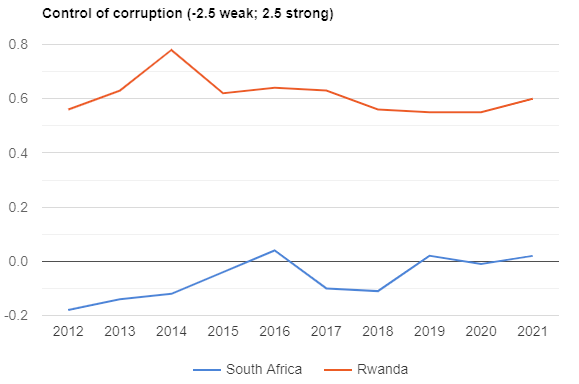
Control of Corruption: Rwanda neared 0.8 in 2014 and remained strong at 0.6 in 2021.
South Africa briefly improved until 2016 but fell again, aligning with State Capture Commission findings.
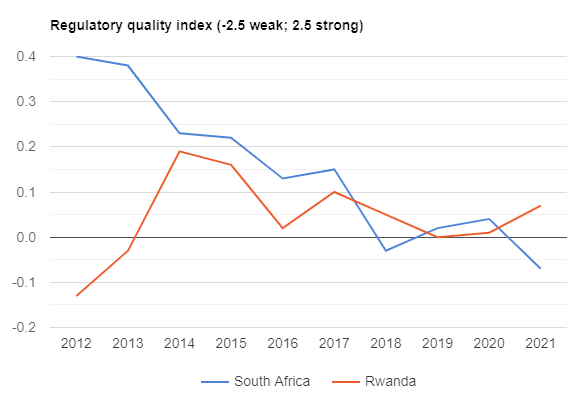
Regulatory Quality: Rwanda improved early on but leveled off slightly above 0.05 by 2021. South Africa dropped from 0.4 in 2012 to -0.085 in 2021, reflecting weak policy confidence.
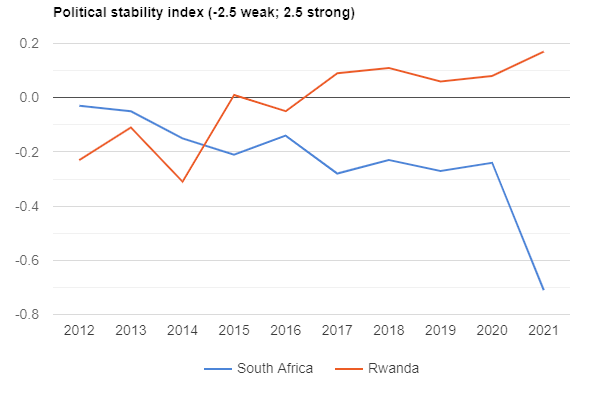
Political Stability: Rwanda improved markedly from 2014–2021. South Africa deteriorated from -0.085 to -0.72, consistent with the 2021 unrest.
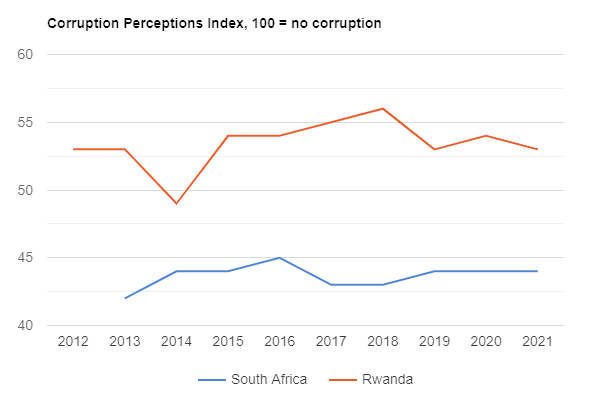
Corruption Perception Index: Rwanda rose from 48 to 53 (2014–2021). South Africa hovered in the mid-40s, indicating stagnant perceptions of corruption.
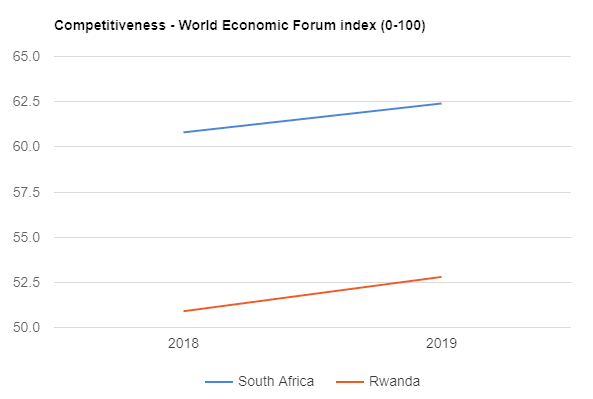
Competitiveness: Rwanda inched up from 51 to 53 (2018–2019); South Africa rose modestly from 61 in 2013 to just under 62.5 in 2019.
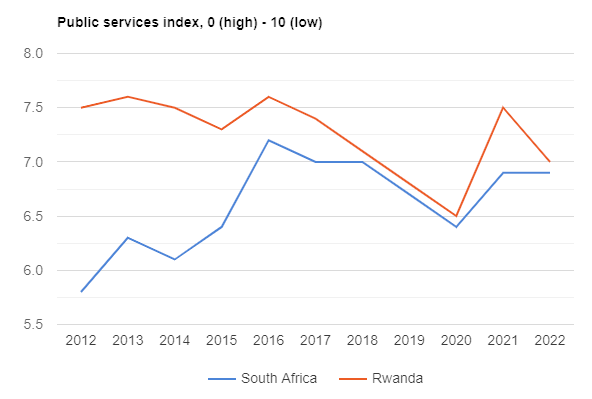
Public Services: Rwanda improved from 7.6 to 6.5 (lower is better) between 2016–2020. South Africa’s reliability score fell to 3.2, below Rwanda’s 5 on a 1–7 scale.
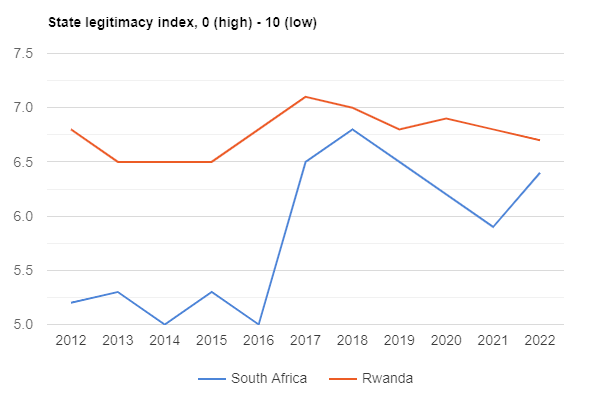
State Legitimacy: Rwanda showed gradual gains, while South Africa’s score declined to 6.4 in 2022, suggesting waning public trust.
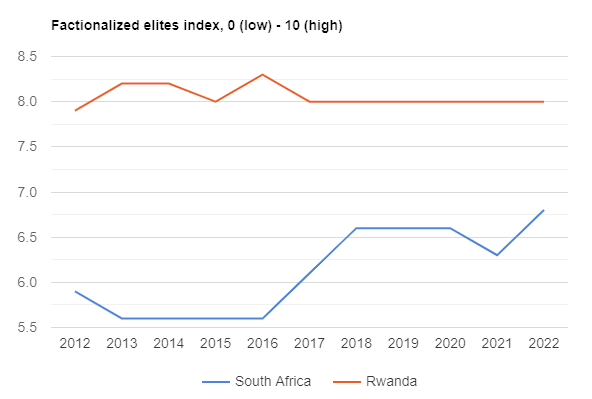
Factionalised Elites: Rwanda maintained a stable score of 8.0 (2017–2022). South Africa declined to 6.8 in 2022, reflecting elite division and institutional gridlock.
The positives
Despite South Africa’s broader governance challenges, several government departments often meet or exceed their service delivery targets based on the “Effective Score” metric, which measures deviations between projected and actual performance.
Departments like Home Affairs, Social Development, Basic Education, and Cooperative Governance frequently achieve or surpass their goals, with Basic Education and Cooperative Governance consistently meeting targets perfectly.
The Department of Transport shows customer satisfaction gains but inconsistent train punctuality.
International comparisons reveal similar trends: the UK and Australia experience mixed results, Mauritius exceeds health targets, and Rwanda excels in justice services.
The report concludes that South Africa performs comparably with its peers in some key service delivery areas.
However, merely meeting targets, especially without achieving zero deviations, may indicate complacency, suggesting a need to revise goals to promote greater progress.